Samples
Overview
Selecting Samples on the top menu brings up the main sample management view. Here, samples can be created, viewed,edited, analyzed, and removed.
What happens during sample creation?
Sample FASTQ files are copied into a new sample directory. The files are compressed if necessary. Files associated with the sample can be viewed and downloaded under the sample detail tab.
Quality information is calculated from the library using FastQC and committed to Virtool’s database.
The FASTQ files and quality data support further analyses triggered by the user.
Browse samples
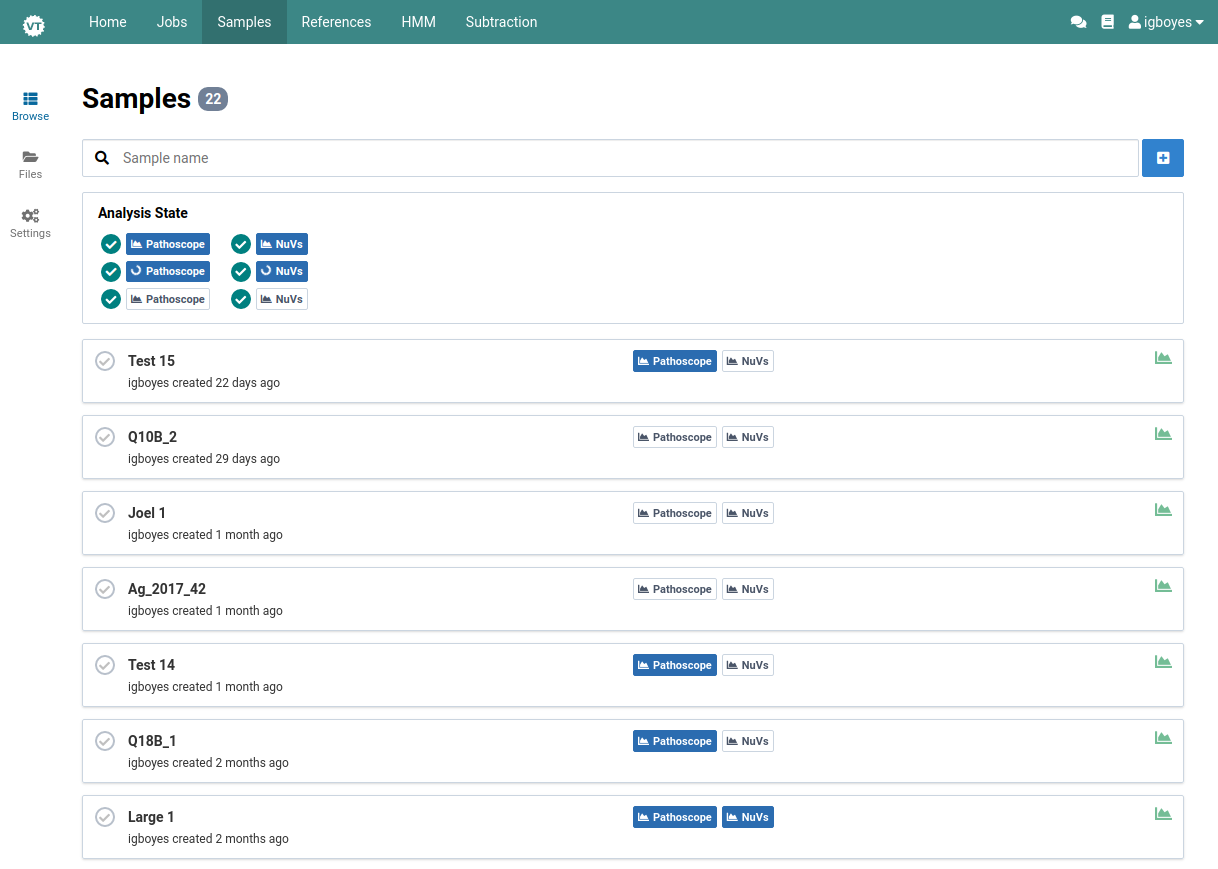
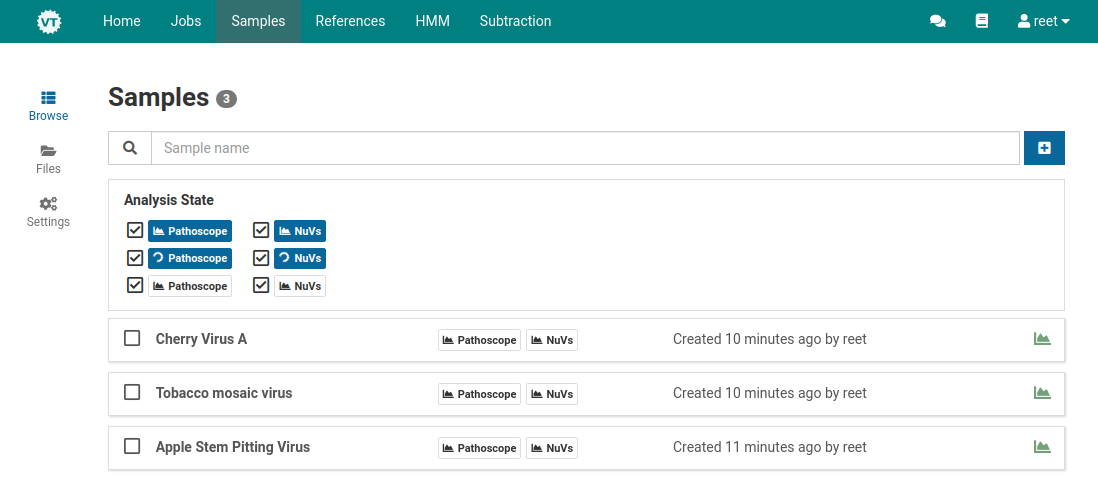
Once you have imported one or more samples, they can be browsed in the main sample management view.
-
Navigate to the Samples view
-
Enter a search term in the search input
-
Use the status filters to further narrow the list of samples
For each workflow (Pathoscope, Nuvs), the sample can have:
- no analysis available
- analysis in progress
- at least one completed analysis
This searches for samples with names containing q10 that have a completed Nuvs analysis:
-
Click a sample to navigate to its detail view
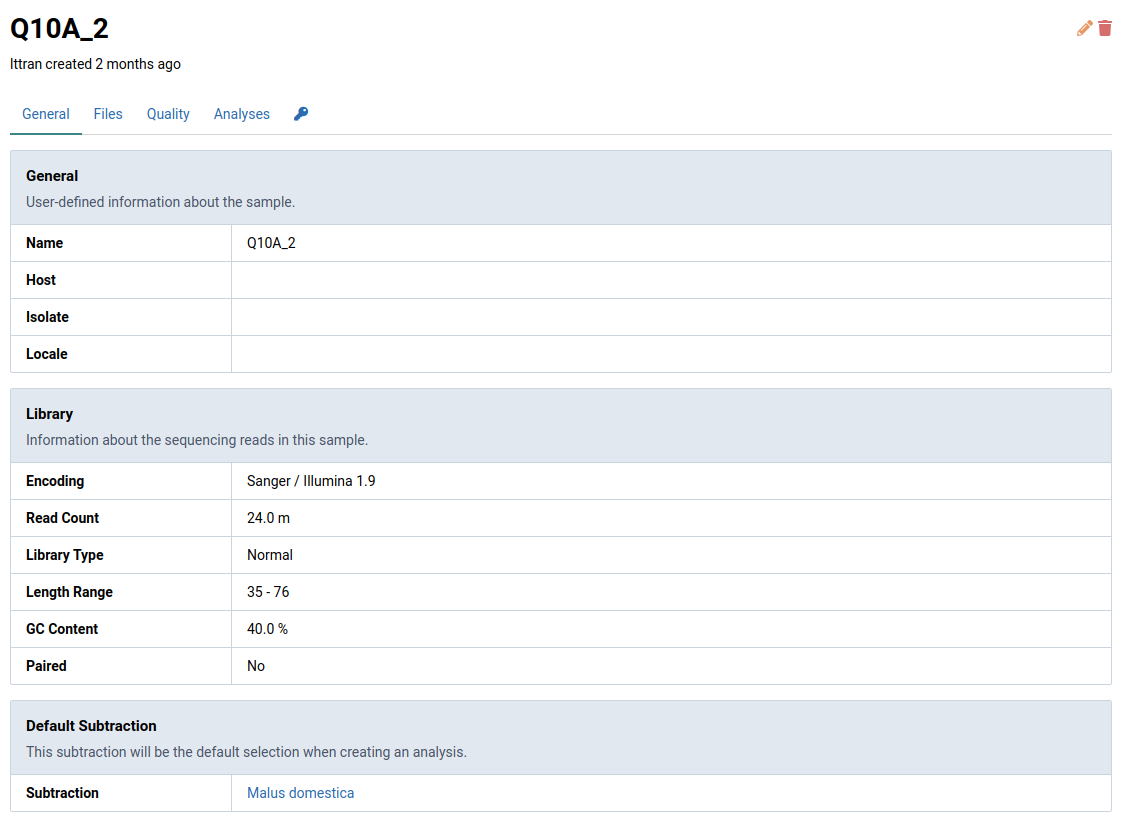
Here is the detail view for the sample named Q10A_2.
Start quick analysis
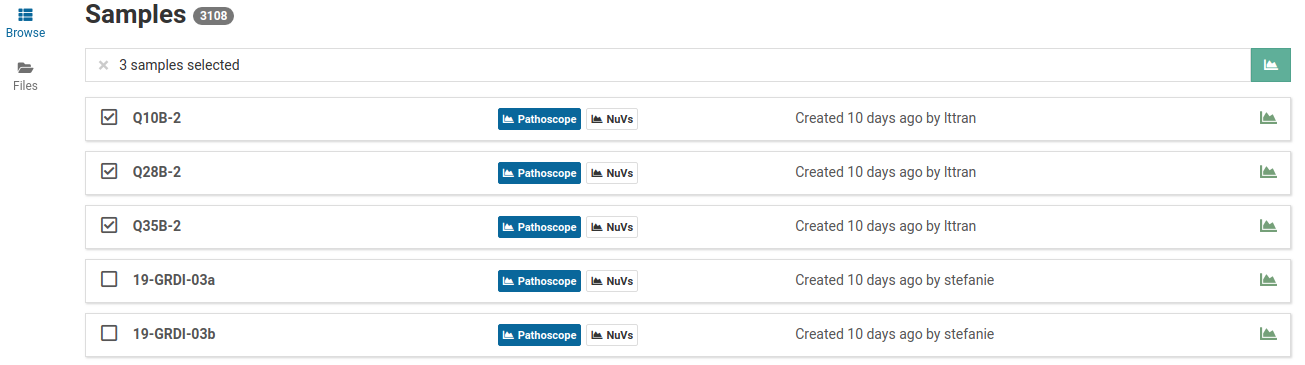
Quick analysis lets you start analysis jobs for multiple samples at once.
-
Select the samples of interest and click .
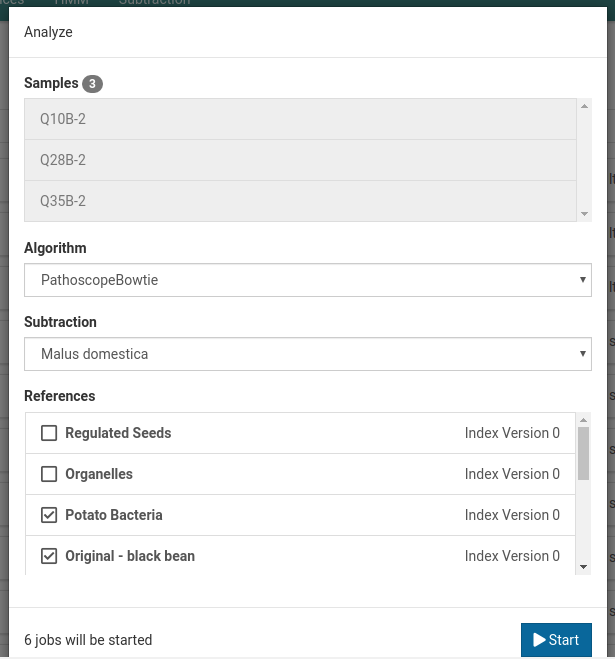
An Analyze dialog box appears.
-
Choose the workflows (PathoscopeBowtie or Nuvs), subtraction, and references you want to use to analyze your samples.
Selecting multiple references starts a separate job for each sample-reference combination.
-
Click Start to start the analysis jobs.
-
Wait for the analysis to complete.
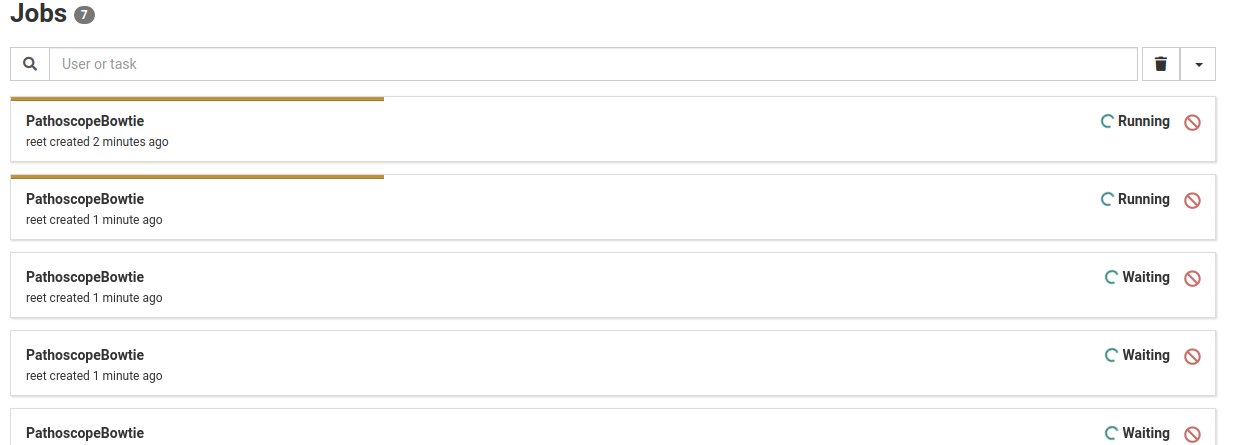
Once the analysis is running, you can view its progress under the Jobs tab.
Create a sample
-
Go to Samples view via the main navigation bar
-
Click Files in the left sidebar and upload a FASTA file.
-
Return to the Samples view and click to open the sample creation dialog
The uploaded file appears in the file list.
-
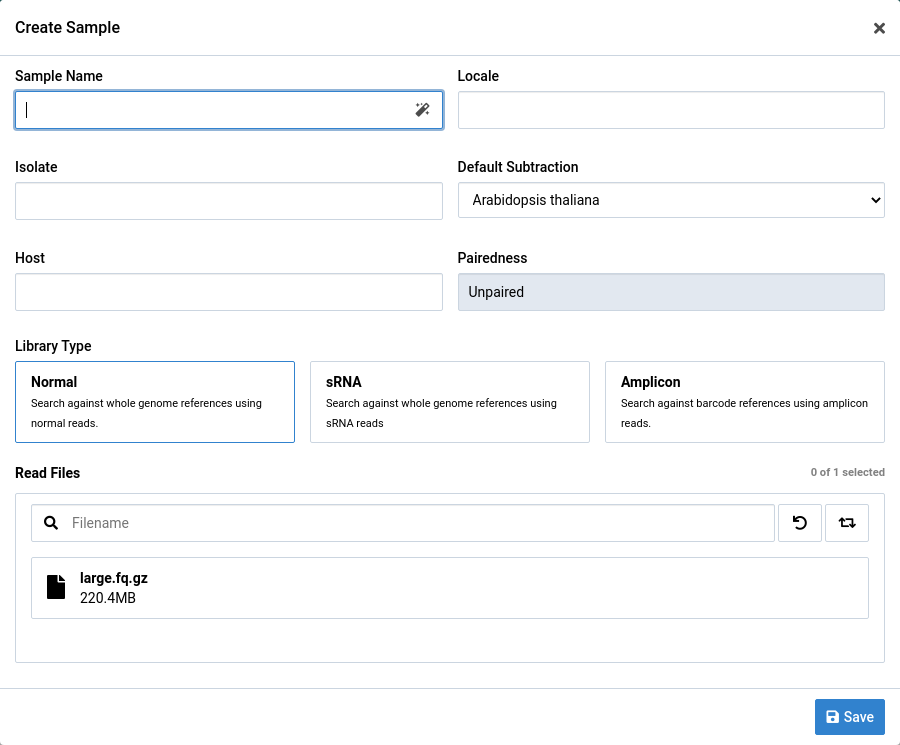
Populate the sample creation form.
You must set a unique sample name and read size. Read size can be set to either normal, sRNA, or amplicon. Later analysis workflows run using different parameters based on the read size setting.
The sample creation dialog allows you to set optional metadata including isolate, locale, and true host.
An default subtraction must be selected. This should be the subtraction genome most closely related to the true host for your sample.
Paired and Unpaired FASTQ Data
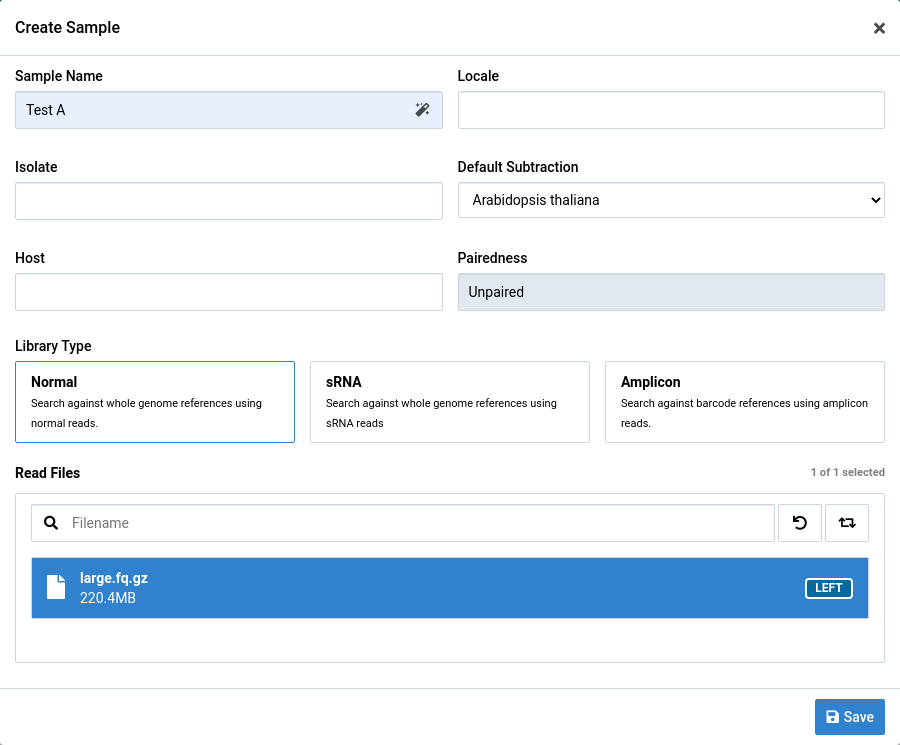
Paired or unpaired FASTQ data can be used to create a sample.
Samples created from only one file are assumed to be unpaired. Paired samples must comprise two paired FASTQ files. Interleaved FASTQ files aren’t currently supported.
For paired data, check that the file orientation labels (left and right) are correct before you create a sample. You can use the button to swap orientations.
Default Subtraction
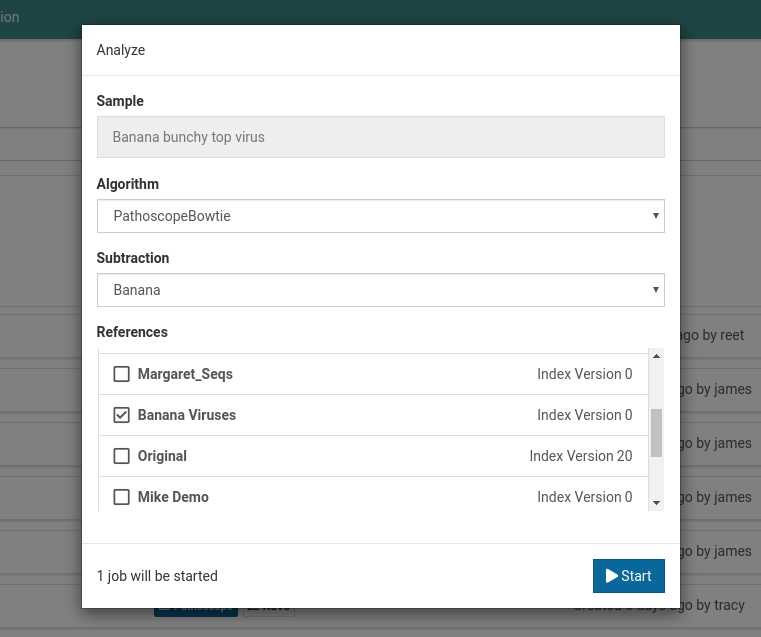
The default subtraction is preselected whenever you create an analysis for the sample. You can find the default subtraction for a given sample at the bottom of its detail view.
For Banana bunchy top virus below, the default subtraction is Banana. This was the same subtraction that was selected when first creating this sample. Once a default subtraction has been made for a sample, you can’t change it.
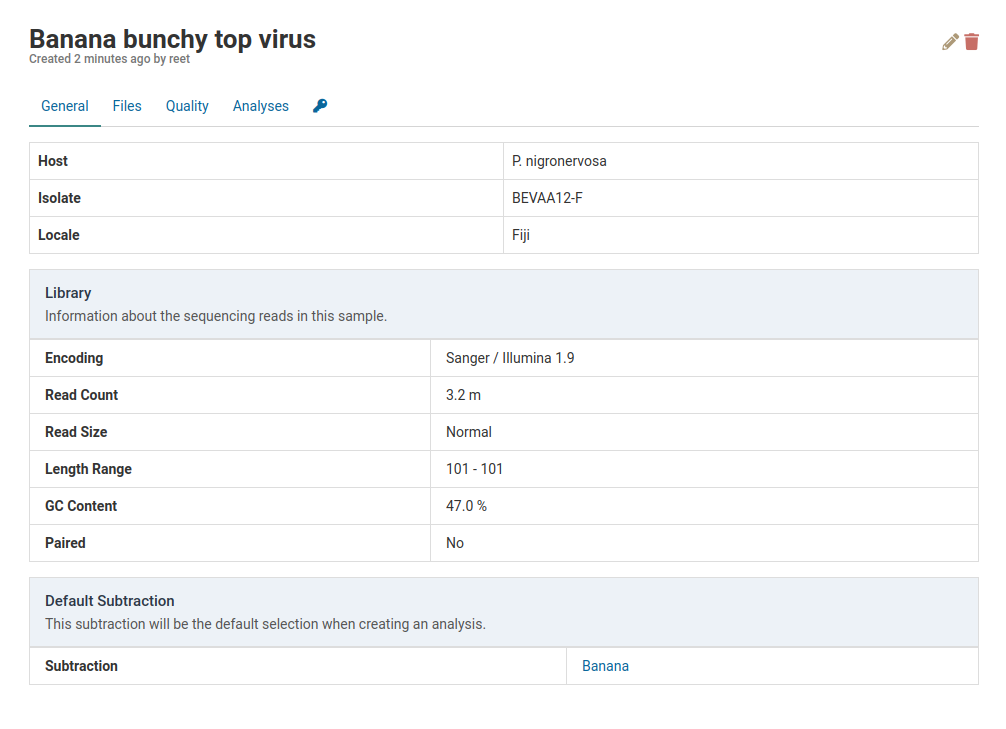
When you open an analysis creation dialog for the sample, the default subtraction (Banana) is already pre-selected.
-
Click Save to create the sample and start the sample creation job.
You should immediately see a placeholder for your sample in the Samples view. The spinner indicates that the sample is still being created.

-
Wait for job to complete.
Your sample looks something like this when it’s ready.

Interpreting sample quality
Quality metrics are calculated using FastQC during the sample creation process. These metrics are based on the raw data provided by the user.
The quality information can be viewed under the Quality tab:
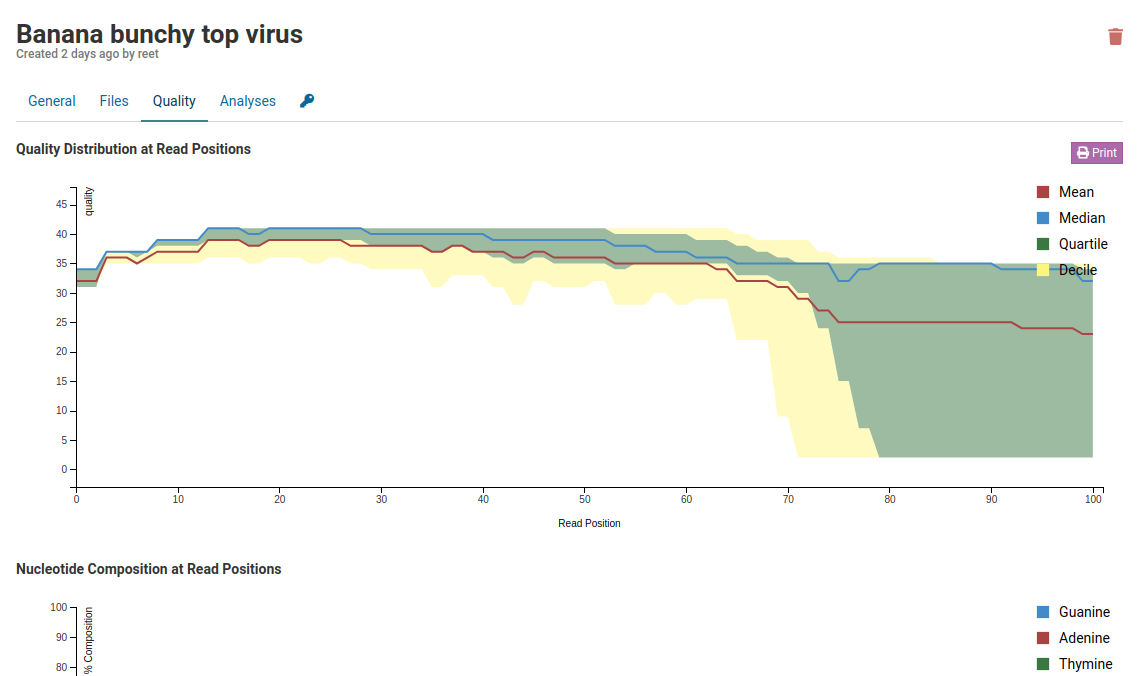
The page shows three graphs.
Quality distribution at read positions
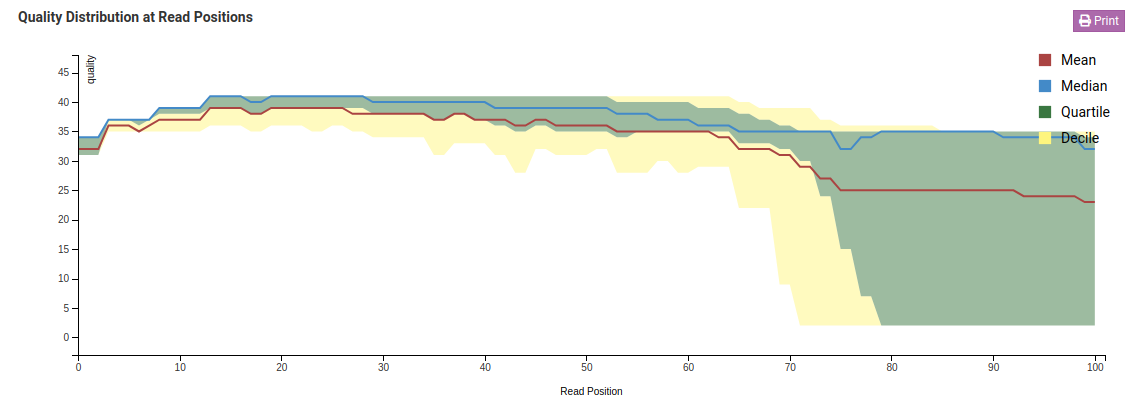
This graph shows the quality of your sample library. The Y-axis shows the quality score, the higher the better. The quality tends to decrease as the run progresses.
A median below 25 or a lower quartile below 10 is cause for concern. The sample shown here has sufficient quality for further analysis.
Nucleotide composition at read positions
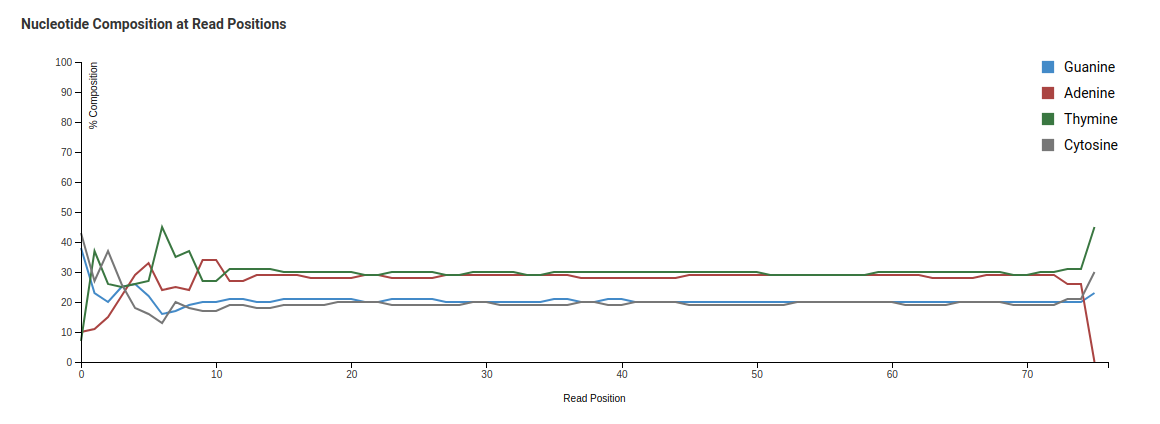
This plot shows the proportion of each nucleotide at every read position. In a diverse library, nucleotide proportions shouldn’t vary systematically by read position, so the lines should be roughly parallel. Overall nucleotide composition depends on the library; viral genomes may, for example, be A/T-rich.
Read-wise quality occurrence
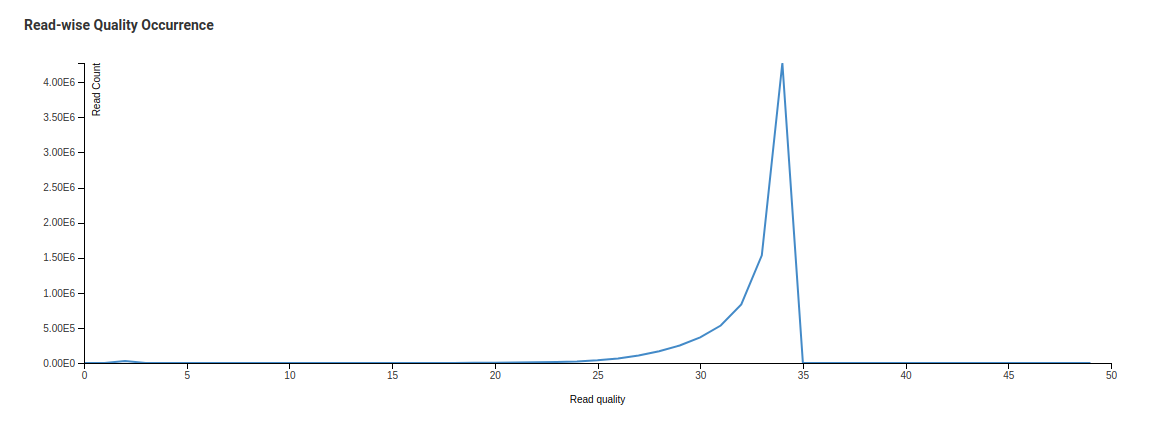
In this case, every sequence is evaluated by looking at the mean score across all the bases in that particular sequence. The distribution of those means is then plotted as shown previously. All sequences should form one tight distribution (sharp curve) with universally high quality and no sequences of low quality. This sharp curve is the average quality per read. A mean quality below 27 is a cause for concern.
Edit a sample
-
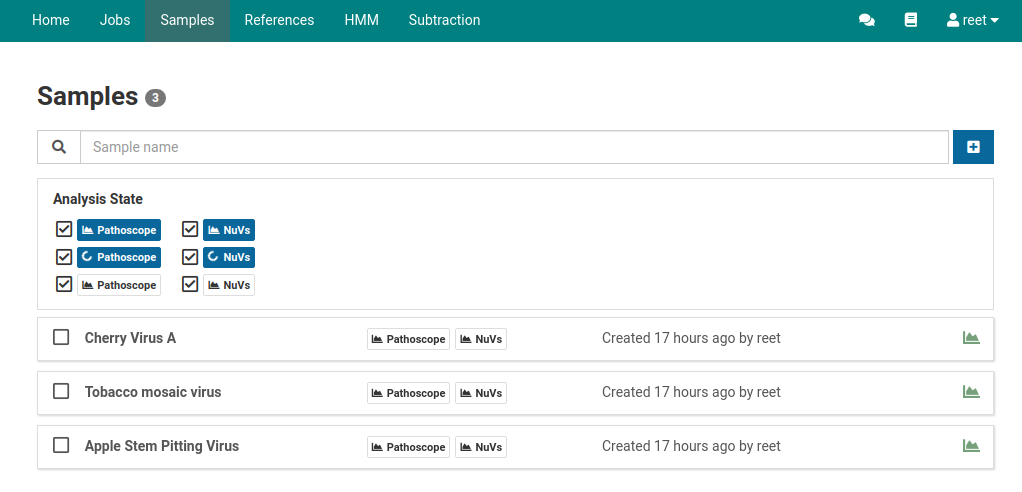
Click Samples in the top navigation bar to see the sample listing.
-
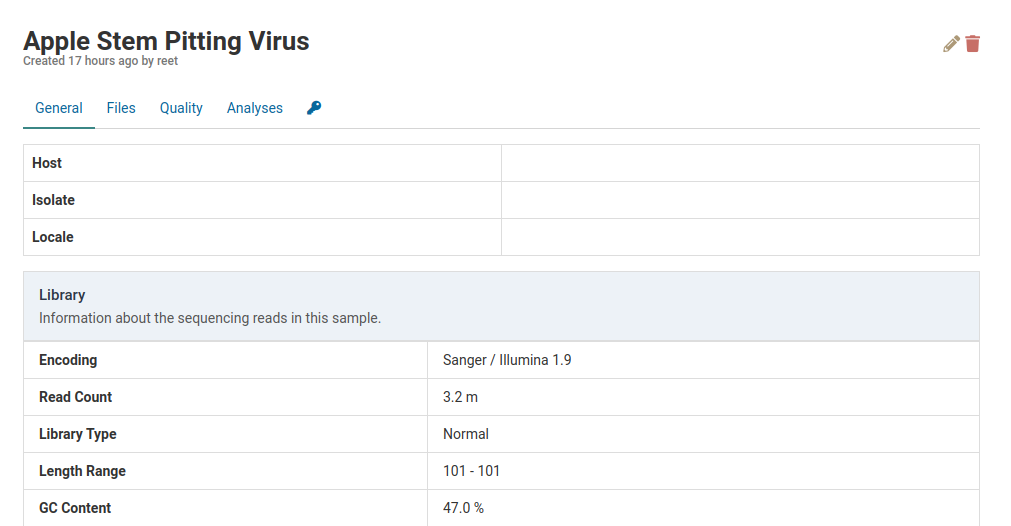
Click the sample to edit. In this example, select Apple Stem Pitting Virus.
-
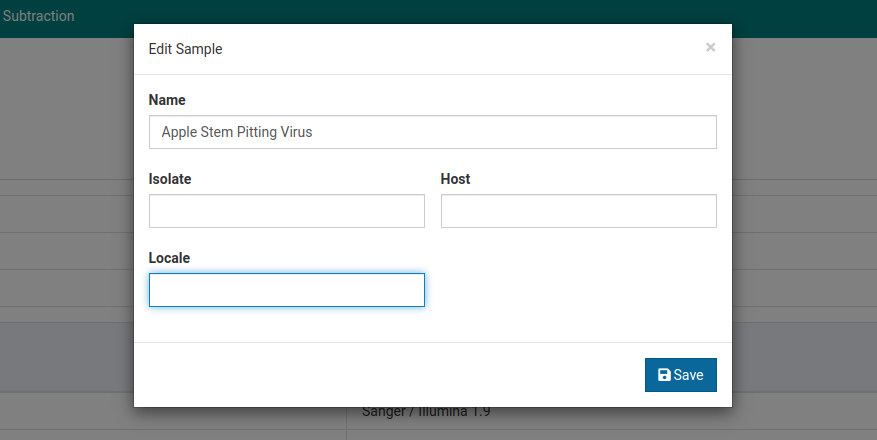
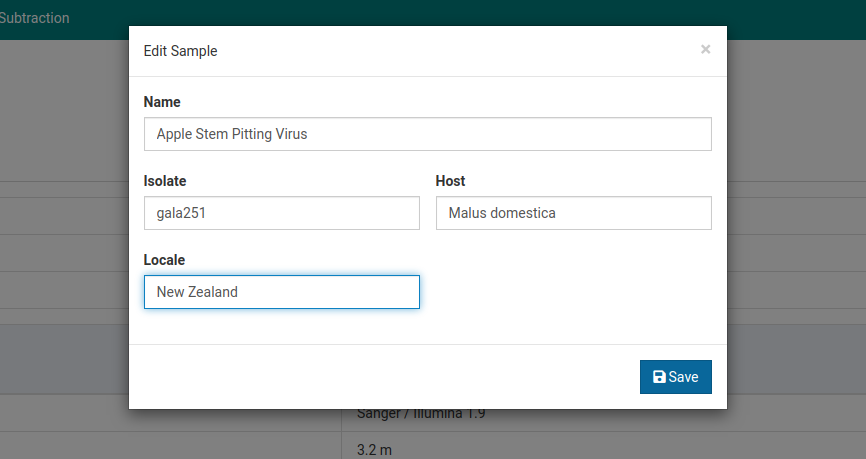
Click to open the sample editing dialog.
-
Make your changes and click Save to save them.
-
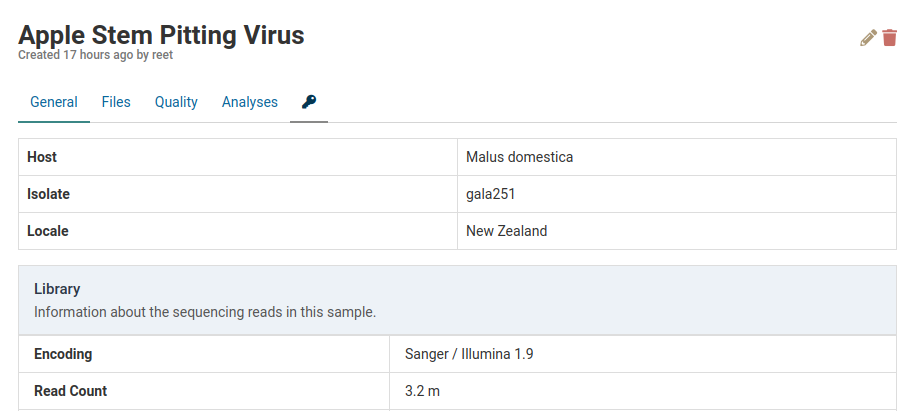
The changes are reflected in the sample detail view.
Delete a sample
- Click Samples in the top navigation bar to see a list of available samples.
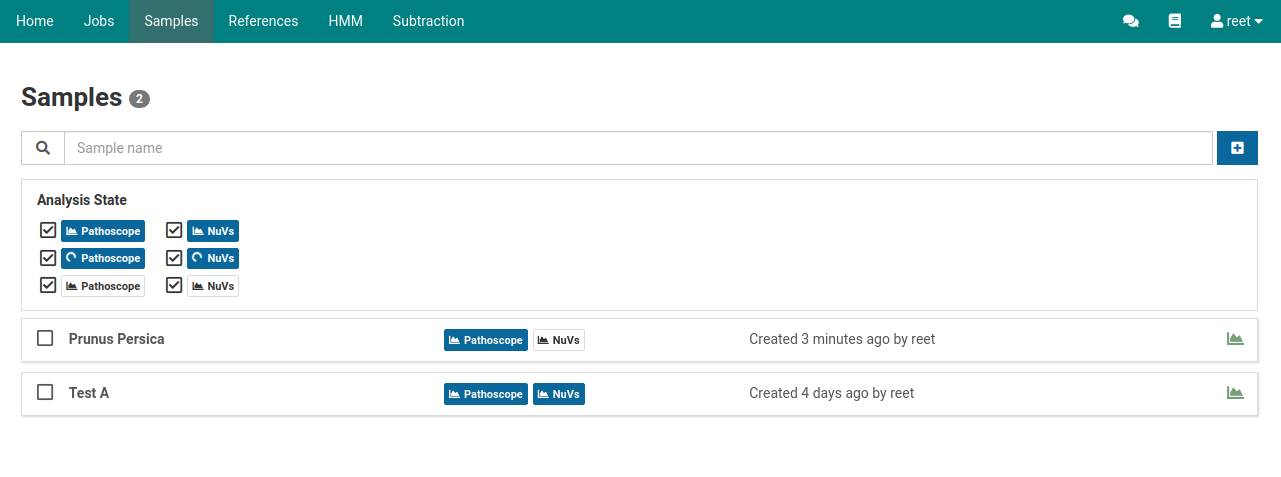
Click the sample to delete. In this example, delete Test A.
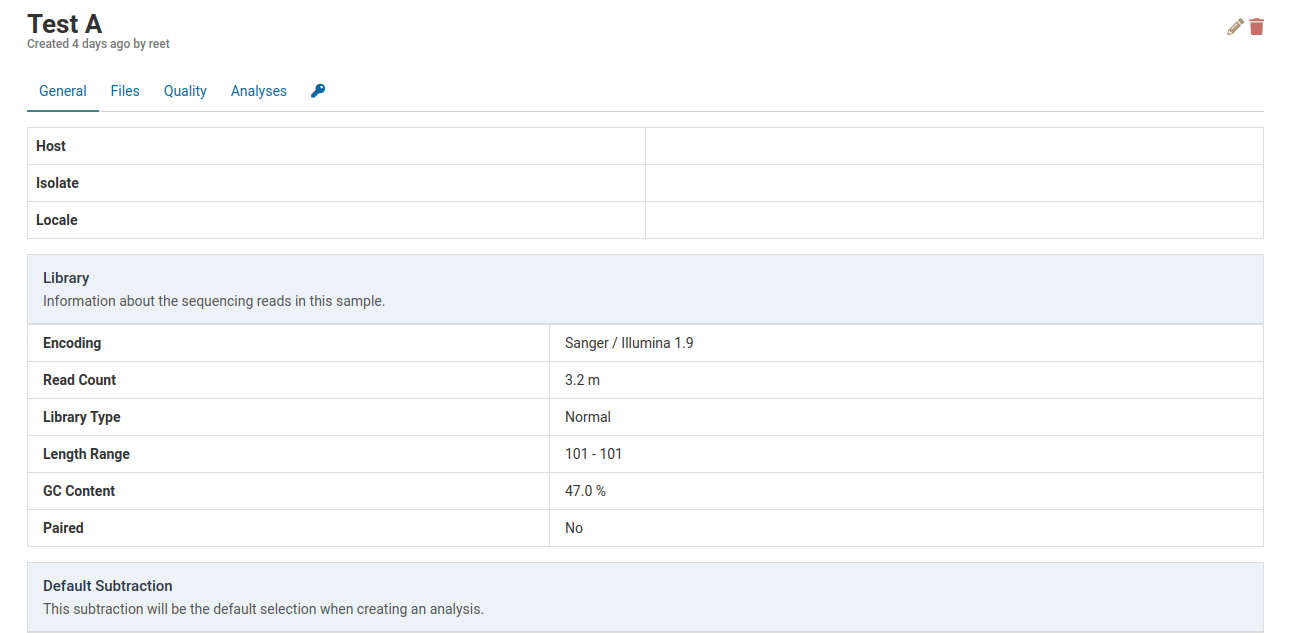
Click the to delete the sample. A dialog box such as the one below shows up to confirm the deletion of the sample.
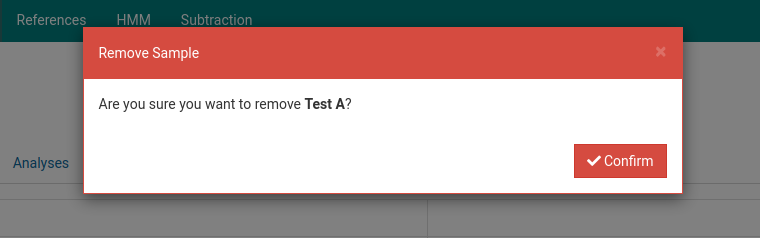
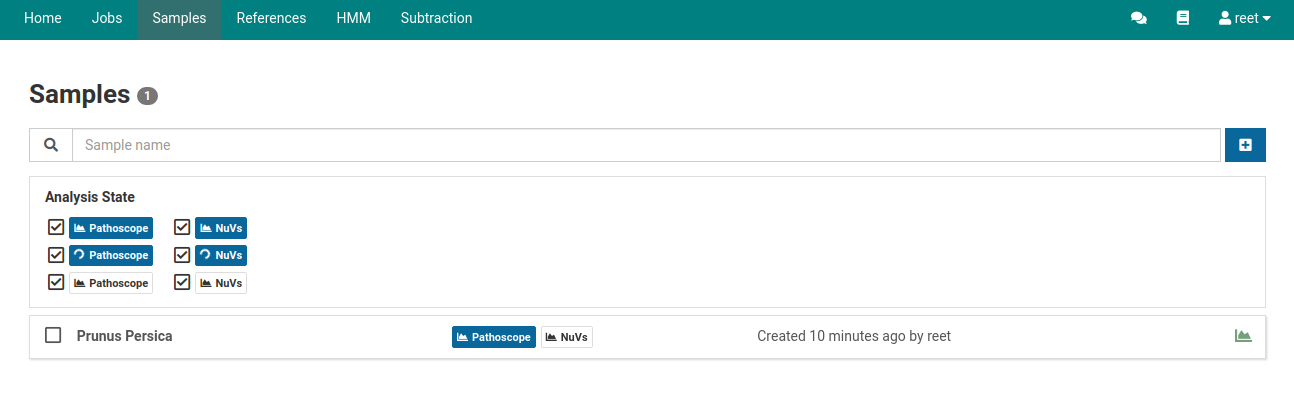
Click Confirm. The sample is now removed from the samples list.
Download a FASTQ file
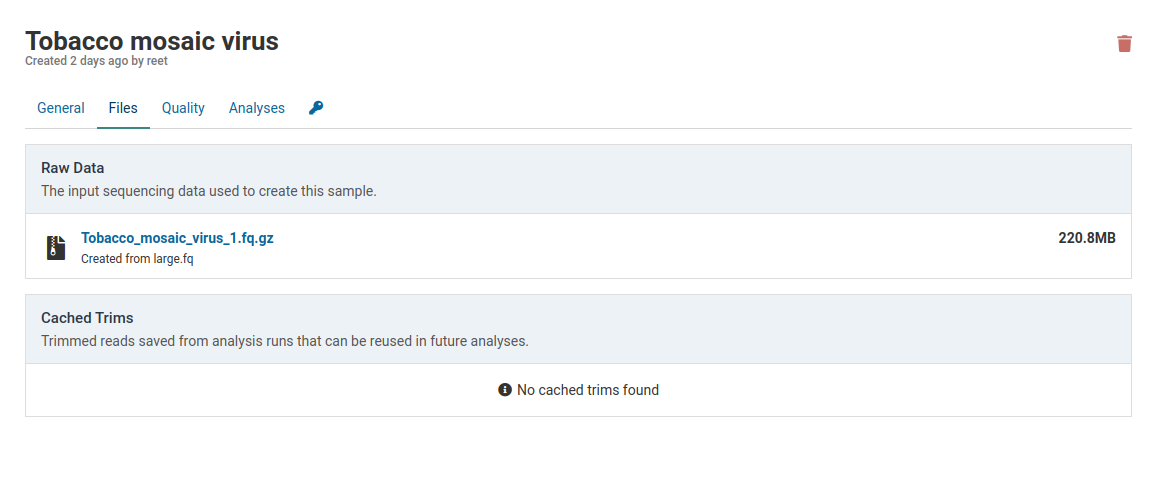
You can download the original FASTQ files used to create a sample. To do so, click the sample of interest. Then click Files.
Click the link under Raw Data to download the FASTQ file that was originally used to create the sample.

Trim caches
Sample data is automatically trimmed during analysis to remove sequencing artefacts and low quality regions. After the first analysis, the trimmed data is cached for reuse in future analyses that use the same trimming parameters. This saves running the trimming workflow steps for every analysis for a given sample.
A sample that hasn’t yet been analyzed has no caches associated with it.
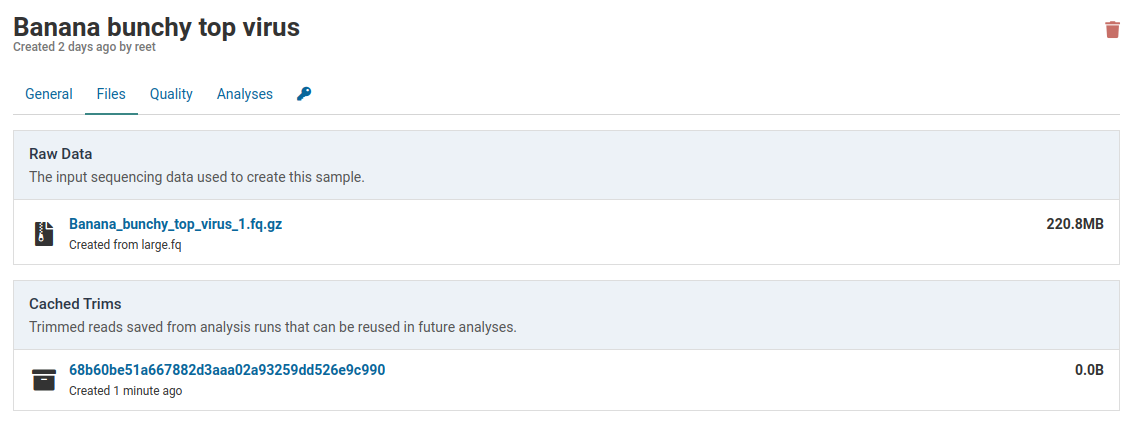
Running an analysis for this sample creates an analysis job. During the job the raw sample reads are trimmed and cached for future analyses. As soon as trimming is complete the cache is created.
Caches are always smaller than the raw data. This library was reduced from 220.8 MB to 153.9 MB. This is due to removal of low quality reads and localized shortening of reads with low quality ends.
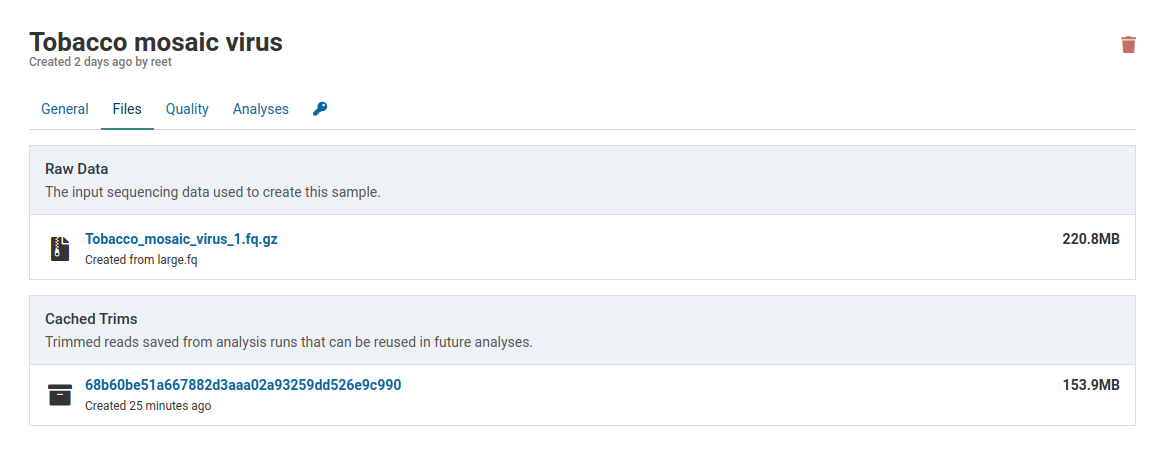
When you click the link under Cached Trims you see all the parameters used by the trimming program as well as the name of the trimming command (skewer-0.2.2). The hash is a unique identifier for the program-parameters combination used to trim this cache.
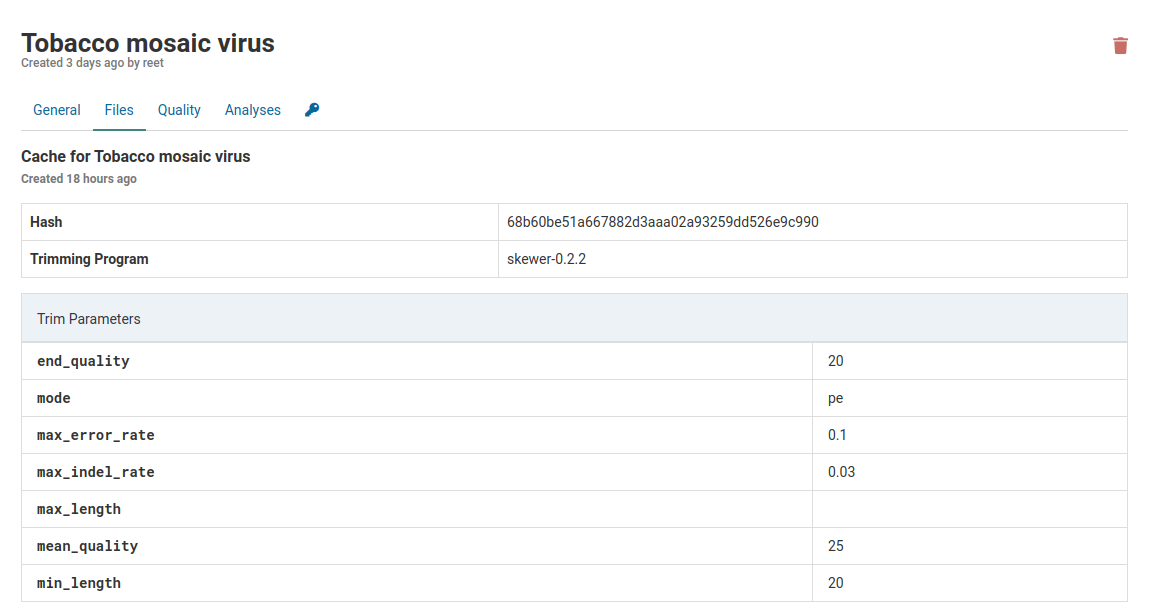
Additionally, below the parameters you see the quality of the data that has been trimmed and cached.
Trim cache quality
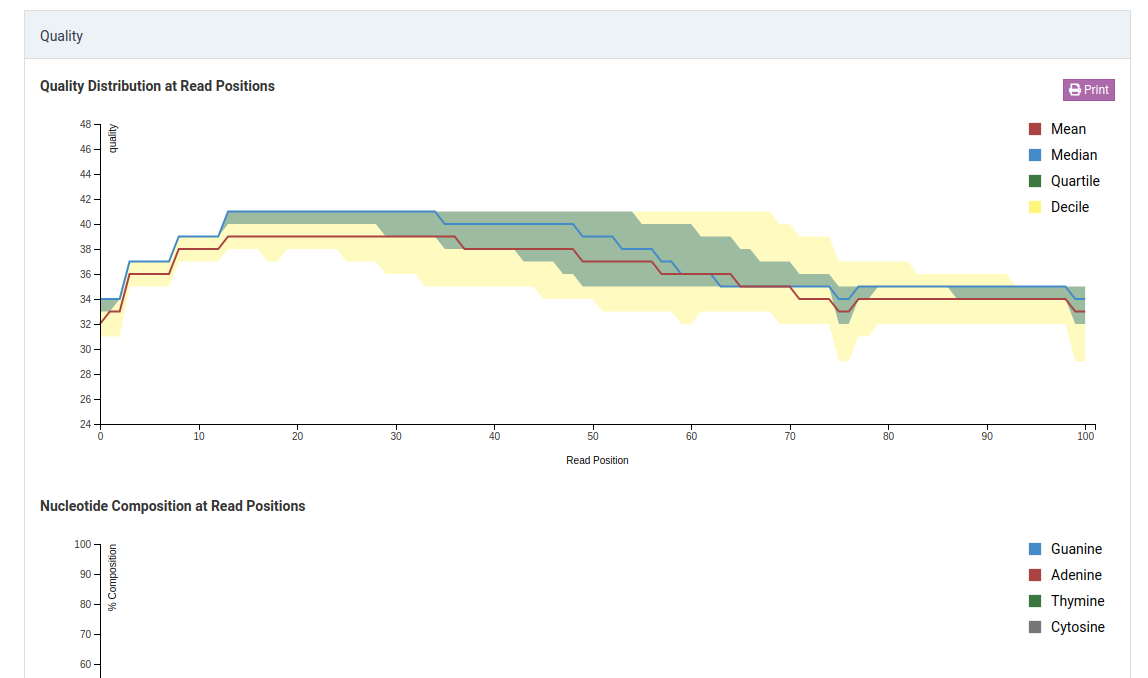
Quality metrics are recalculated for reads trimmed during an analysis. The quality information is associated with the generated trim cache. Since low quality reads are discarded and low quality ends are removed, the trim cache quality metrics are expected to improve over those for the raw data.
Quality distribution at read positions - raw
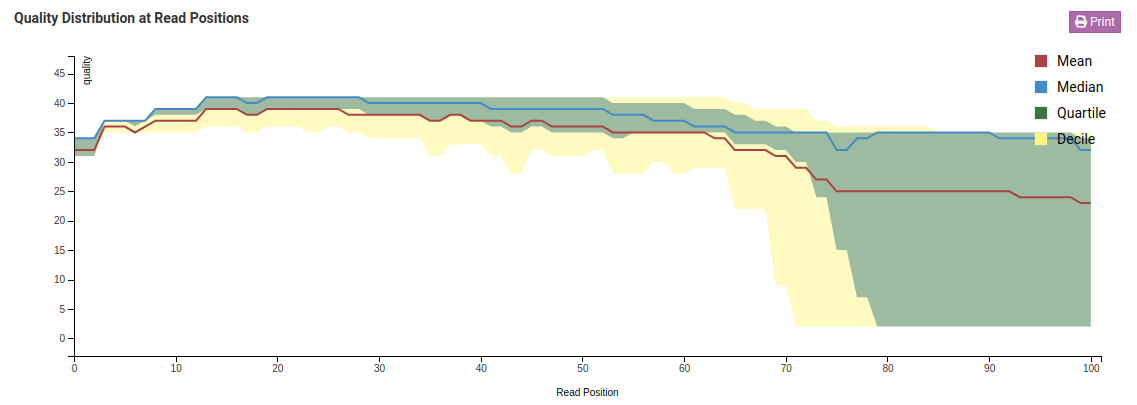
Quality distribution at read positions - trimmed
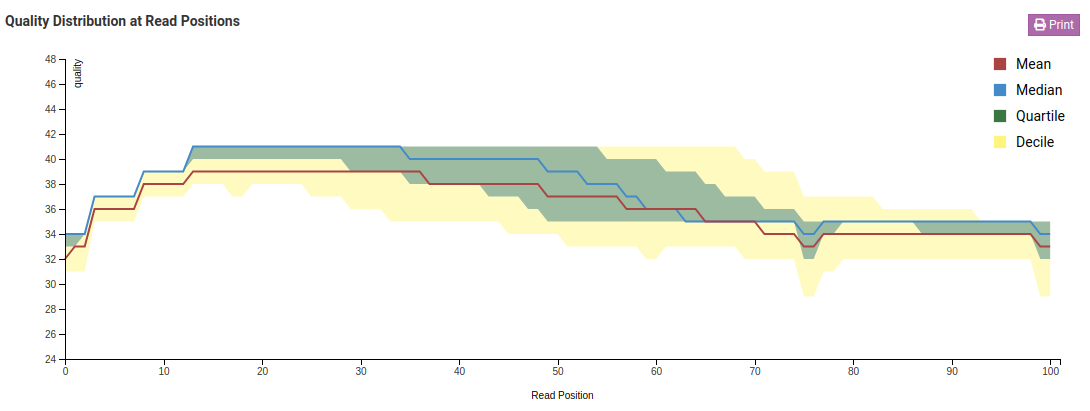
In the Quality Distribution at Read Positions - Raw chart, the mean base quality degrades closer to the end of the read. This is a common issue in Illumina libraries. In the Trimmed charts, low quality ends were removed. As a result, both quality measures increased.
Read-wise quality occurrence - raw
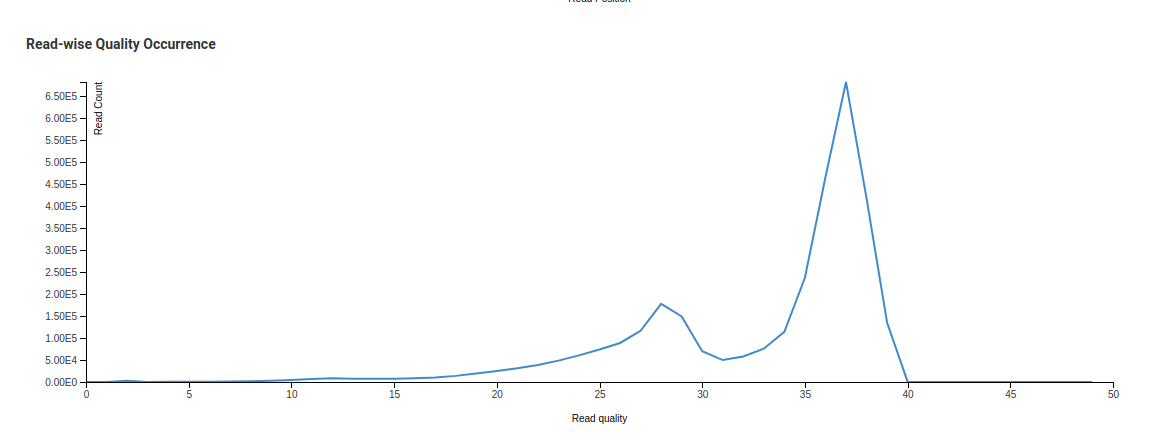
Read-wise quality occurrence - trimmed
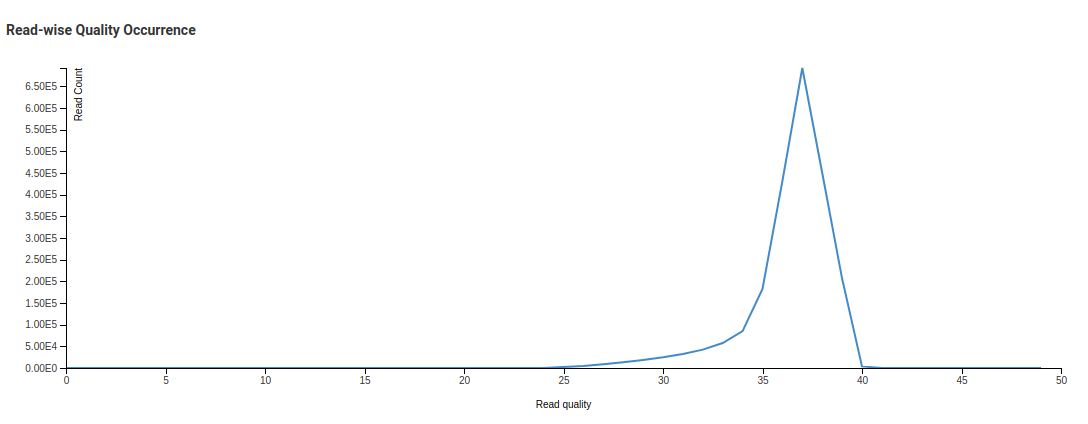
The Read-wise Quality Occurrence - Raw image shows one small curve before a sharp peak. This is due to a significant number of reads with low mean quality being present in the library. The trimming process discards reads with low mean qualities. This is reflected in the Trimmed chart where the smaller peak is no longer present.
Rights
Concepts
Virtool allows for fine control of the rights users have to view or change samples.
Management levels
Rights can apply at four different levels.
| administrators | Members of the special administrator group. These users have full read and write access to all samples as well as the ability to manage the rights on any sample. |
| owner | The original sample creator. This user always has full read and write access to the sample as well as the ability to manage the rights on the sample. |
| group | The group that owns the sample. Read and write privileges can be independently set at this level. |
| all users | All users registered on the Virtool instance. Read and write privileges can be independently set at this level. |
Group ownership
Each sample can be owned by a user group. This lets multiple groups of diagnosticians or researchers keep their data private while sharing one Virtool instance.
Samples aren’t required to have an owner group. The group can be set to None. In this case, group rights settings have no effect.
Privileges
None
The management level (such as group or all users) can’t read or write the sample. Included users never see the sample in the sample management interface.
This privilege is useful for isolating samples between separate groups of users.
Read
The management level (such as group or all users) can only read the sample. The included users see the sample in the sample management interface and can view its general information, quality, and analyses.
They can’t edit or remove the sample or create new analyses. The elements in the user interface associated with these actions are hidden.
Read & write
The management level (such as group or all users) can only read the sample. The included users see the sample in the sample management interface and can view its general information, quality, and analyses.
They can also edit and remove the sample and create new analyses.
Management
The sample owner or an administrator can change an existing sample’s access rights.
Access the rights management controls by clicking the tab in the sample detail view.
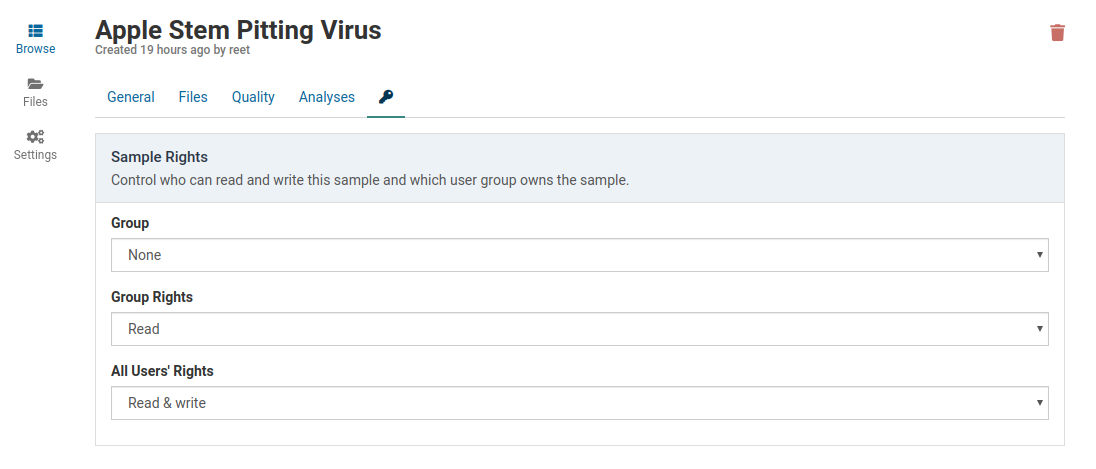
Settings
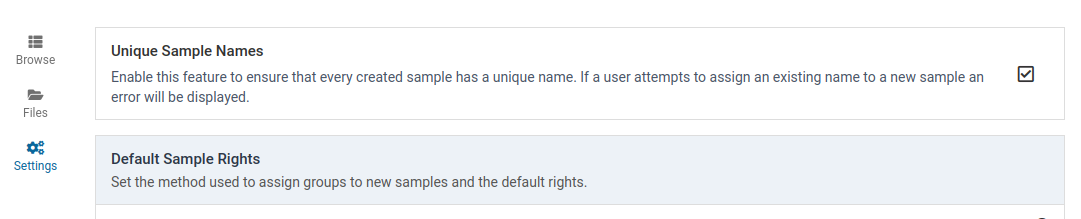
Unique sample names
By default, sample names must be unique to the sample manager. This prevents
confusion between identically named samples. Administrators can change this in
Settings on the Samples page.
Check the Unique Sample Names box to ensure that every created sample has a unique name.
Default sample rights
These settings determine how rights are assigned to newly created samples. Sample rights in Virtool are reminiscent of UNIX permissions.
Sample group
This determines how an owner group is applied to the sample when it’s created.
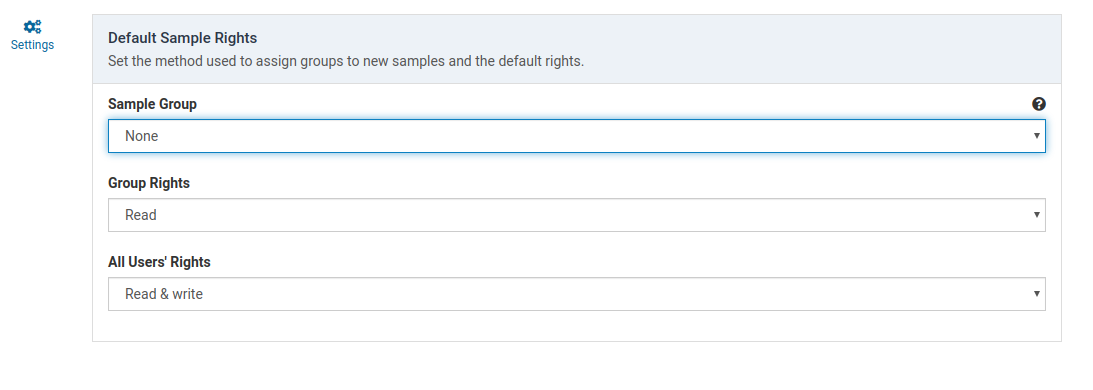
| None | No group owner is assigned. Group rights don’t apply |
| Force Choice | The sample creator is forced to choose the owner group from their member groups |
| Primary Group | The sample is automatically assigned the creator’s primary group |
Group rights
This setting determines how members of the owner group can interact with the sample. If the owner group is None, this setting has no effect. Rights can be changed by sample owners and administrators at any time.
| None | Sample isn’t returned in searches and isn’t accessible by URL. |
| Read | Sample appears in searches. Users can view it but can’t edit it or start analyses. |
| Read & Write | Includes Read rights. Users can also edit the sample and run analyses. |
All users’ rights
This setting determines how any Virtool user can interact with the sample. These rights behave like group rights and can be changed by sample owners and administrators at any time.