Analyses
Overview
Analyses are the results of running a bioinformatic workflow on sample data.
An analysis runs sample data through a series of bioinformatic tools and makes the result available to the user.
Analysis jobs
Analyzing sample data is the most computationally intensive task Virtool performs. It can take minutes or hours to run analyses for large, complex sample libraries.
Long-running analyses are tracked under the Jobs tab.
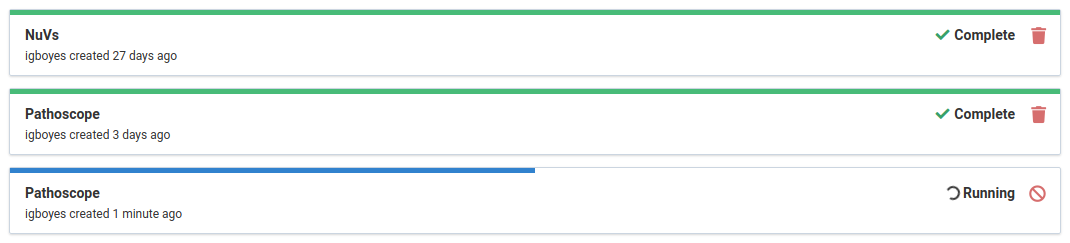
An analysis job links to the sample’s analysis list.
Caching
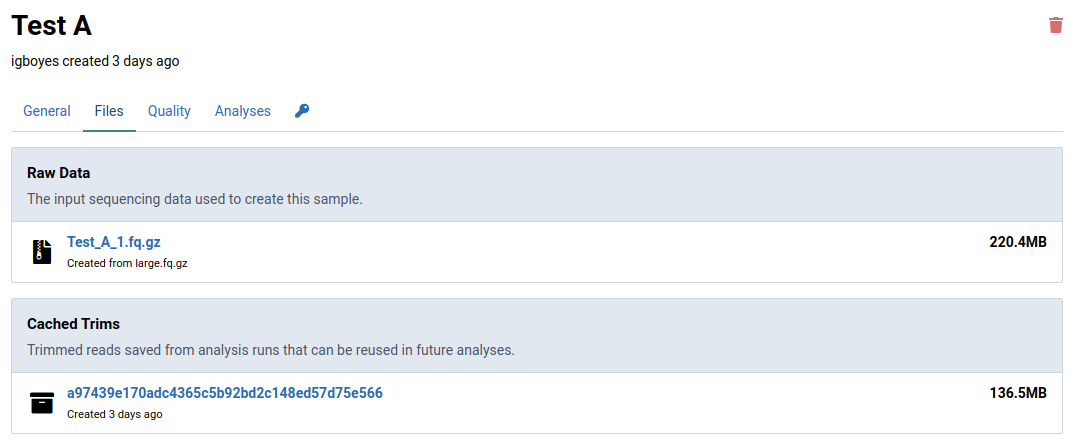
Sample data is automatically trimmed during analysis. Later analyses reuse the cached trimmed data.
Reference versions
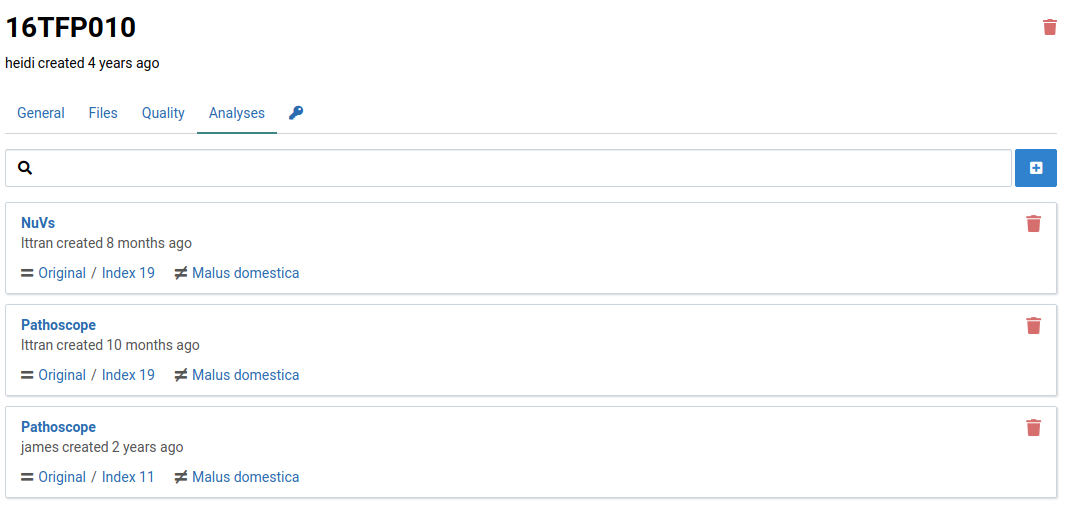
Analyses use references composed of pathogen sequences. Because references are editable and versioned, each analysis is linked to a specific reference version. Create a new analysis to use a newer version.
Here is a sample with analyses from different workflows and reference versions:
Subtractions
Subtractions are sets of host or non-pest sequence data used to remove non-pathogen reads from analysis results.
You can read more about creating and managing subtractions from the links below:
View analyses
-
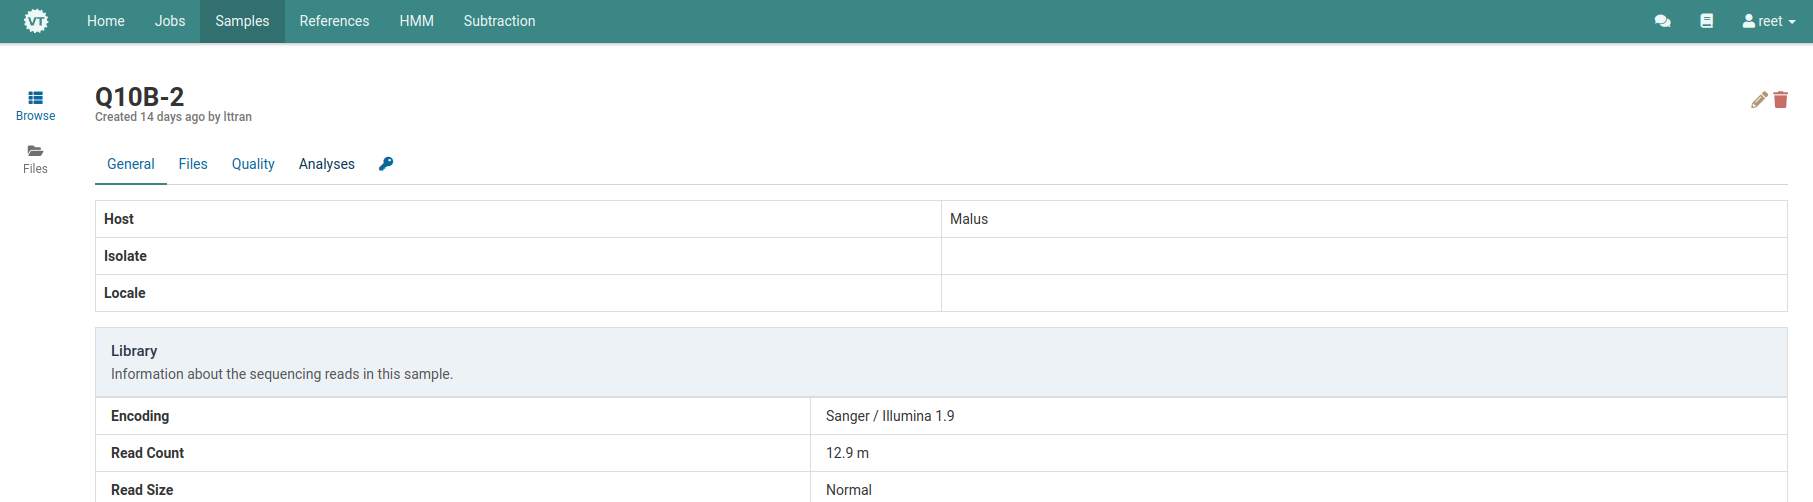
Navigate to a sample and click the Analyses tab
-
View the list of analyses
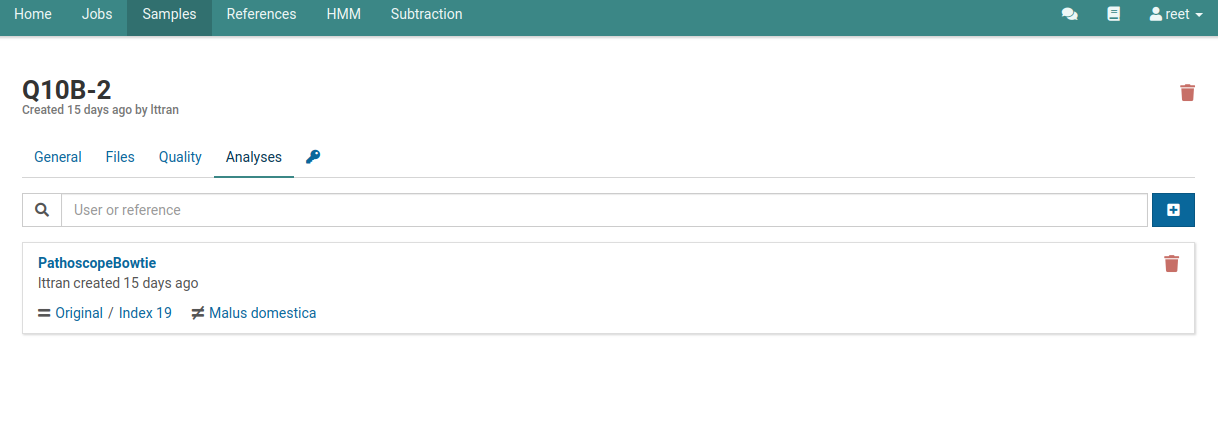
This page lists completed and running analyses for the sample. The following example has one completed analysis.
Create an analysis
-
Navigate to the analyses list for a sample.
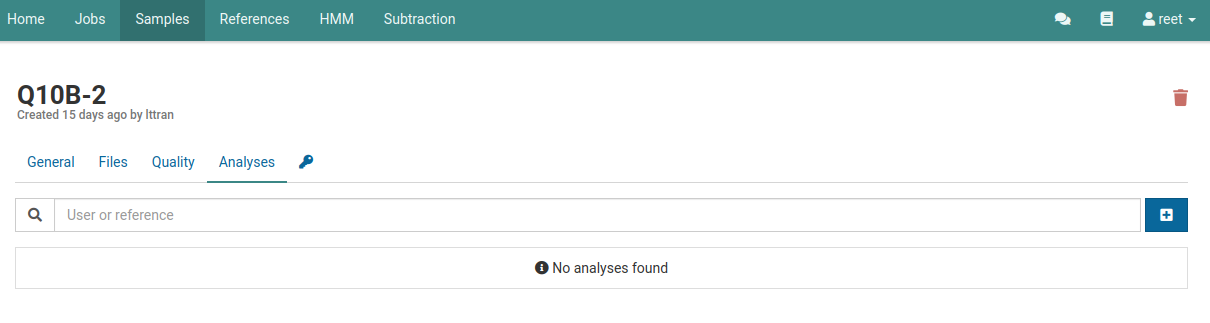
You should see an empty list if you haven’t already created an analysis for this sample.
-
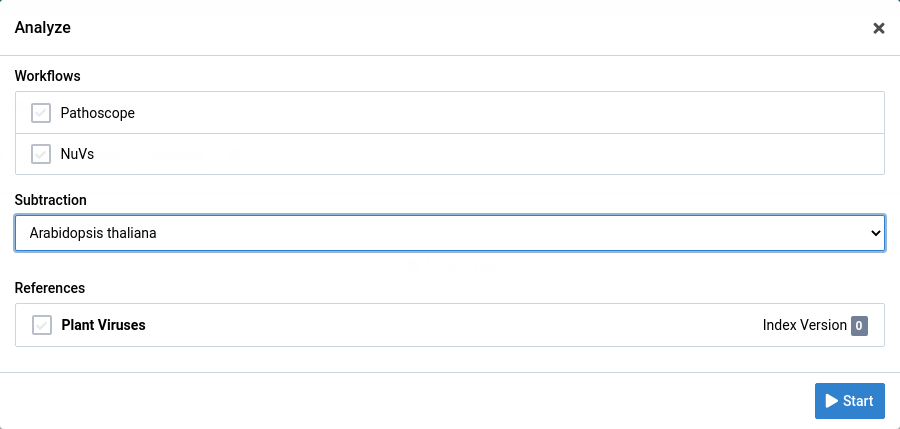
Click the button to open the analyze dialog
-
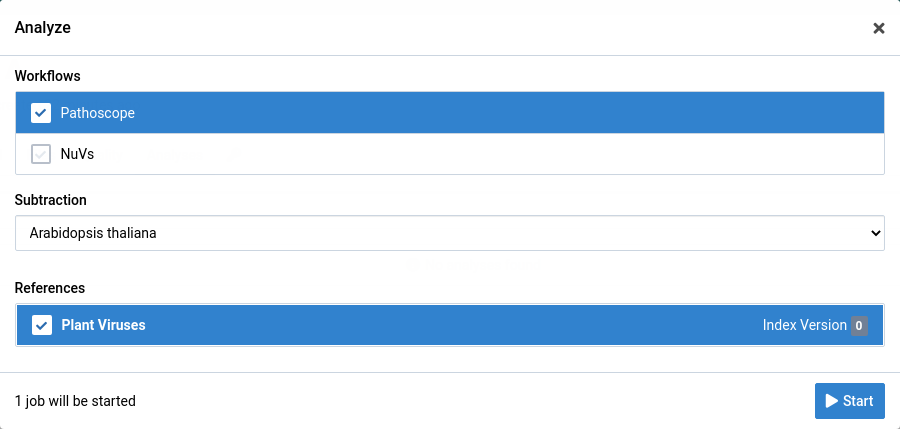
Choose the analysis workflow, subtraction, and reference you want to use.
-
Click Start to start the analysis
The dialog closes and you immediately see your new analysis appear in the list.

When the analysis is complete it looks like this:

-
Go to the Samples view
The sample item is tagged to show that a Pathoscope analysis has been completed.

Multiple samples can be analyzed at once using the quick analysis feature. Read more about quick analyses.
Delete an analysis
Analysis deletion is permanent. A deleted analysis can’t be recovered.
-
Navigate to the analysis list for the sample whose analysis you want to delete
-
Click the icon on the analysis
The analysis record is removed from the list.
Interpret Pathoscope
Pathoscope is a workflow in Virtool used for determining whether a known virus is present in a sample.
-
View the mapping overview.
This shows how many sample reads were mapped to the reference (for example, Plant Viruses) and the subtraction (for example, Arabidopsis thaliana).

-
View the result list
The list shows the viruses Virtool thinks are likely to be in the sample. Each identified OTU can be expanded to show the coverage chart and detailed values for each isolate and sequence.
-
Use the mouse or the w and s keys to select OTUs
-
Click the Filter OTUs button to show all OTUs
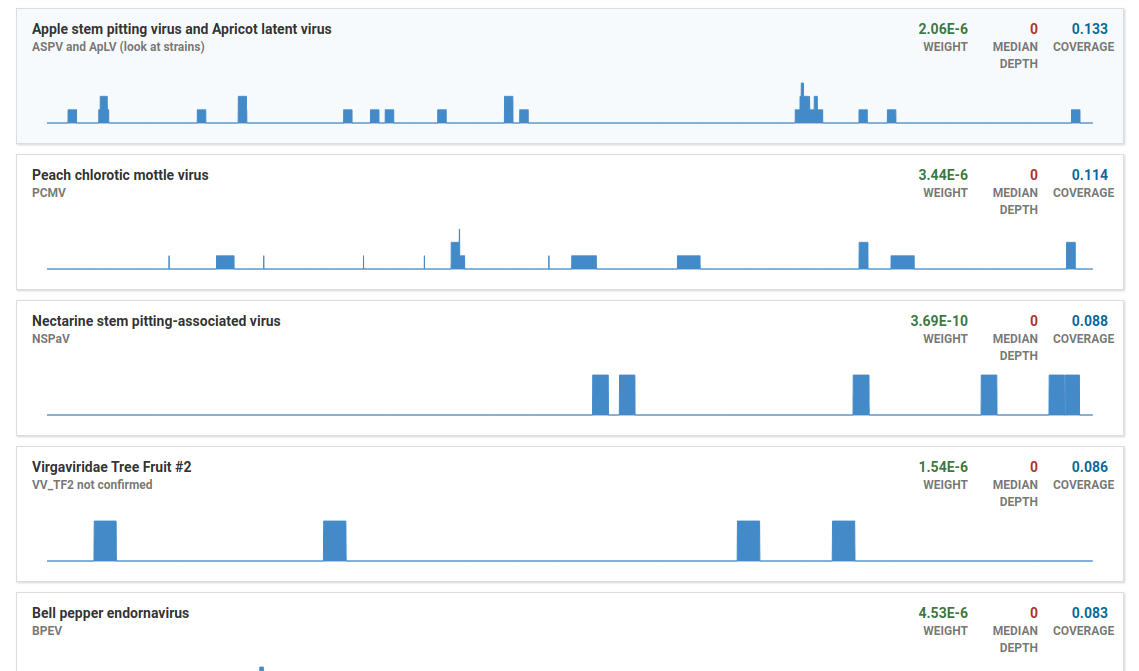
By default, OTUs with low coverage or weight (relative abundance) are filtered out. The OTUs shown here would normally be filtered out:
-
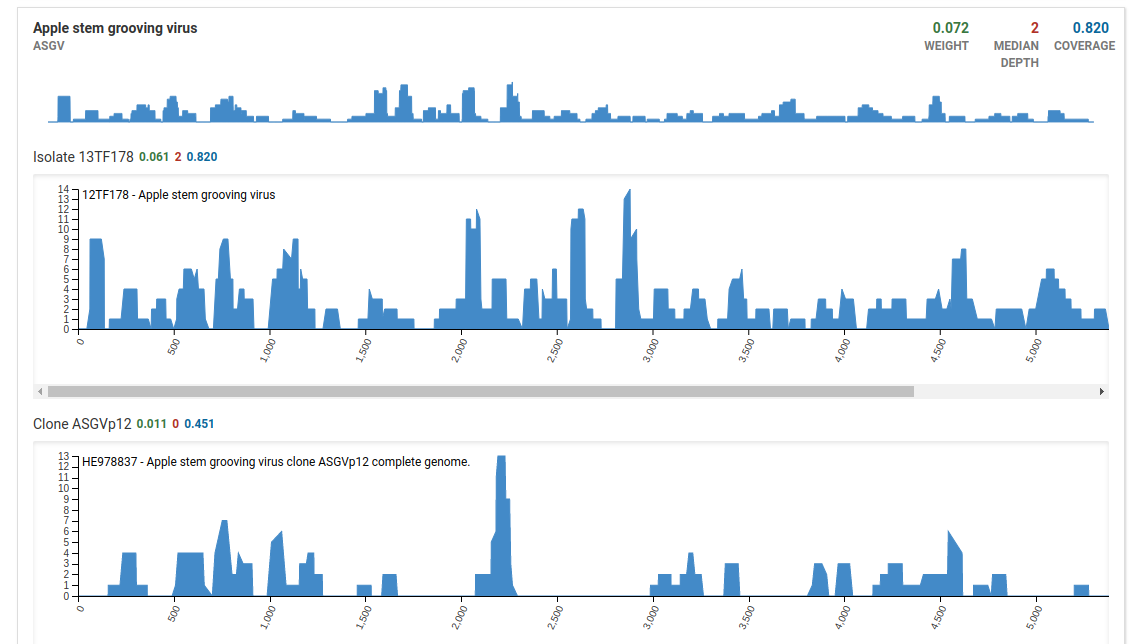
Clicking an OTU shows coverage charts for the isolates
- Deep, wide coverage of an isolate is indicative of an infection.
- Shallow, wide, and broken coverage is suggestive of intra-plate contamination. Hits due to contamination also typically have low weights.
- Isolates with high weight, and deep localized coverage are typical of low-complexity or host-similar regions in the isolate genome and don’t show true infections.
Approximately 5 million reads is a useful baseline for a dsRNA library, but the percentage of mapped reads is more important. For dsRNA, this percentage can range from less than 1% to greater than 80%. Greater viral RNA enrichment, measured by the percentage of mapped reads, reduces the total number of reads required. For example, 100,000 mapped reads—2% of 5 million—may be sufficient.
| Values | Description |
|---|---|
| Coverage | A measure for how well the mapped reads cover the viral genome. In general, coverage of greater than 0.5 indicates positive detection and coverage of less than 0.2 indicates negative detection. |
| Depth | A measure of how many times a genome is covered by mapped reads |
| Weight | The calculated proportion of reads mapping to a virus. The weight is roughly proportional to the titre. Higher the titre, higher the weight. A weight greater than 0.001 is a strong indicator of positive detection. |
Examples
High quality positive
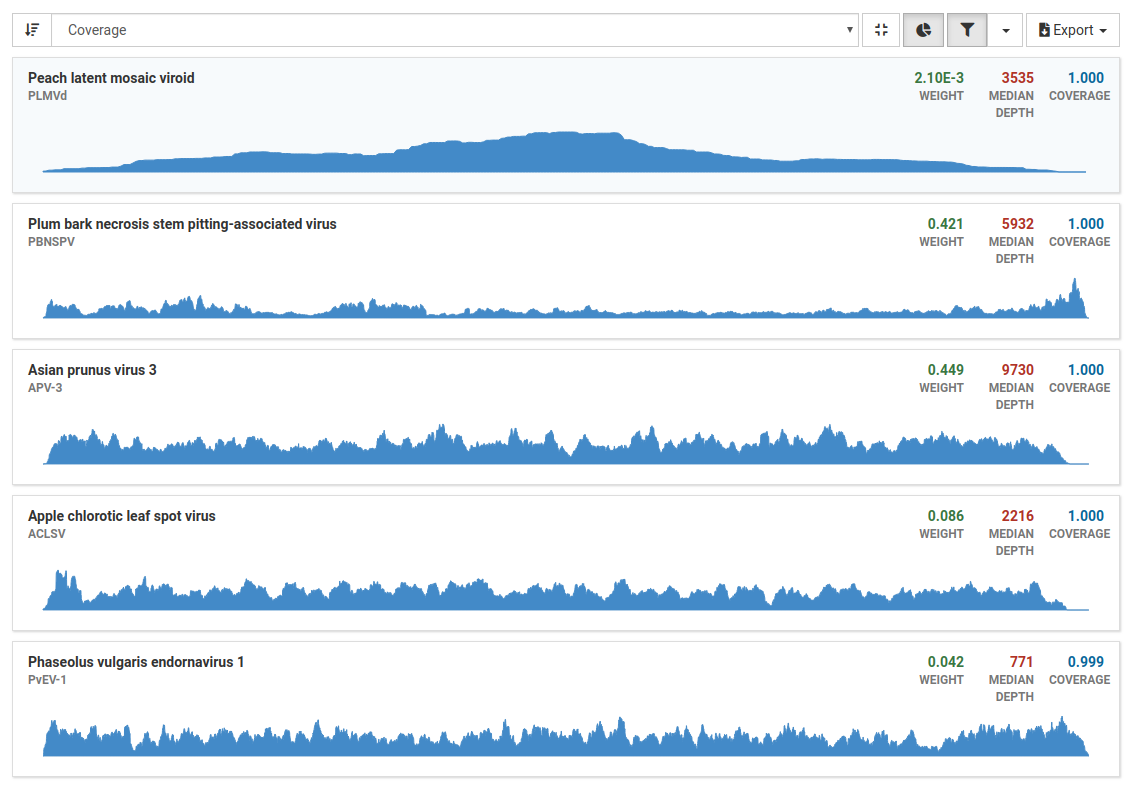
After running Pathoscope, the analyses tab lists all viruses Virtool thinks are likely to be in the sample. In this example, one viroid and four viruses are likely to be in the sample.
By default, pathogens with low coverage or weight (relative abundance) are filtered out. These pathogens can be made visible by clicking .
For this example, the focus is on the five pathogens that have the greatest coverage.
The section on top of the list of pathogens gives a quick overview of the total and mapped reads in the sample.

This sample has over 5.3 million total reads and over 3.7 million mapped reads (69.78% mapped reads), illustrating good enrichment of viral RNA.
The high weight, depth, and coverage values indicate that these pathogens are present in the sample.
Clicking on a pathogen shows sequencing coverage charts for the isolates that may be in your sample.
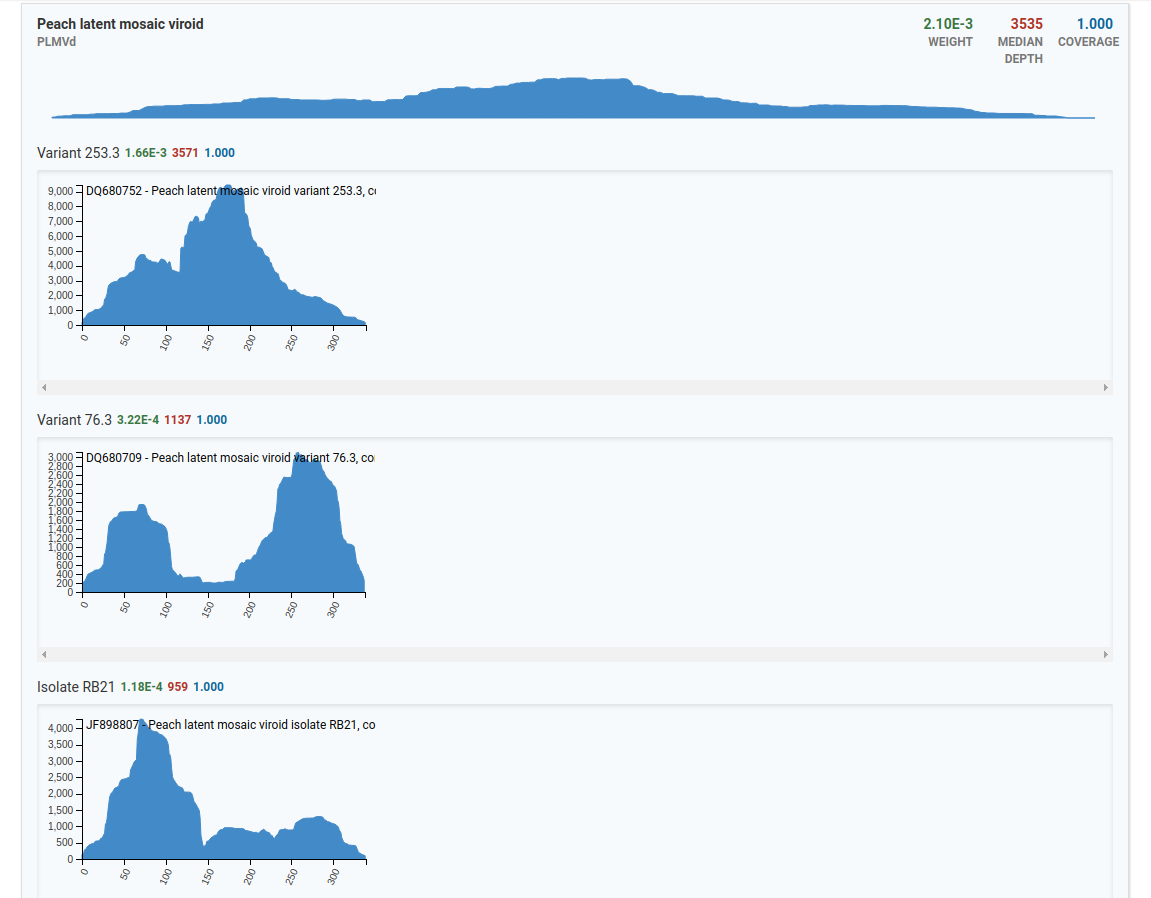
In the top example, there are three isolates for the Peach latent mosaic viroid that are present in the sample. The x-axis represents the genome size and the y-axis represents the number of reads.
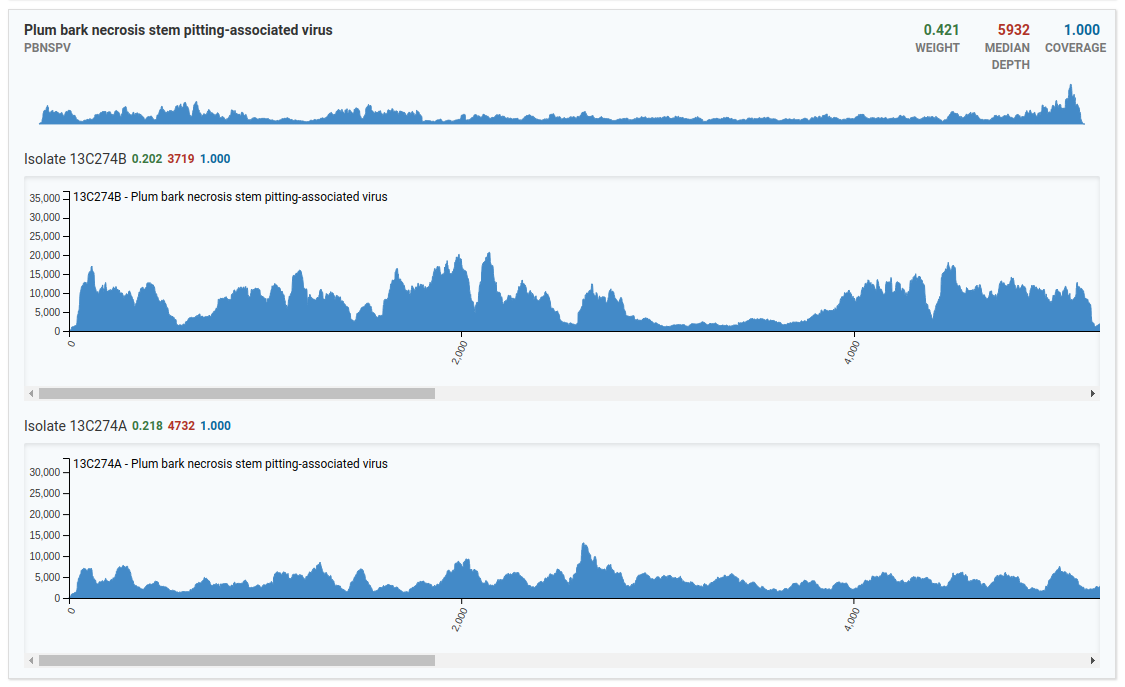
The Plum bark necrosis stem pitting-associated virus result contains two isolate coverage charts. Its viral genome is larger than the viroid genome in the previous example, so the x-axis spans a greater range.
High quality negative
This analysis is from a healthy sample.
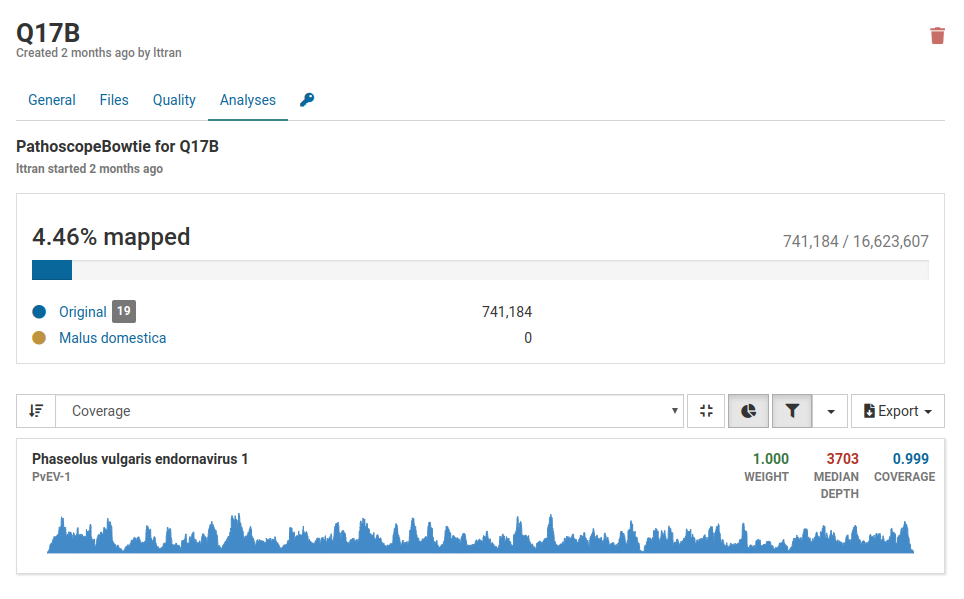
The only virus that’s present in the sample is Phaseolus vulgaris endornavirus 1. This virus was intentionally introduced into the nucleic acid extraction as a positive internal control to verify that the extraction succeeded.
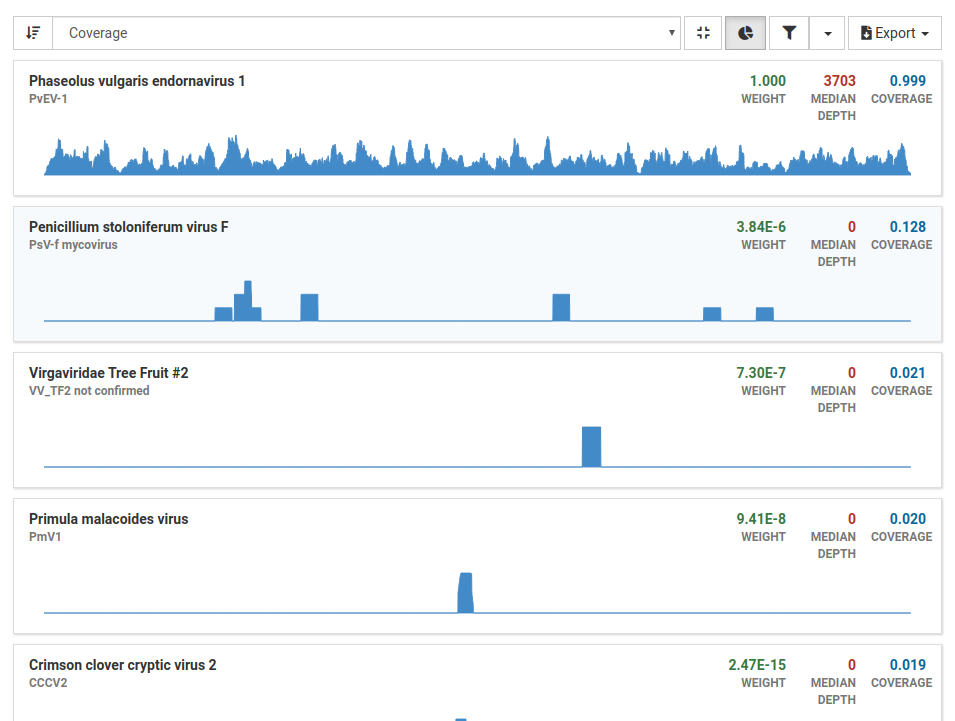
When the results are filtered, all other viruses have low weight, depth, and coverage, indicating that they’re not present in the sample. These results indicate that this sample is from a healthy plant.
Contamination
Below is an example of an analysis from a contaminated sample.
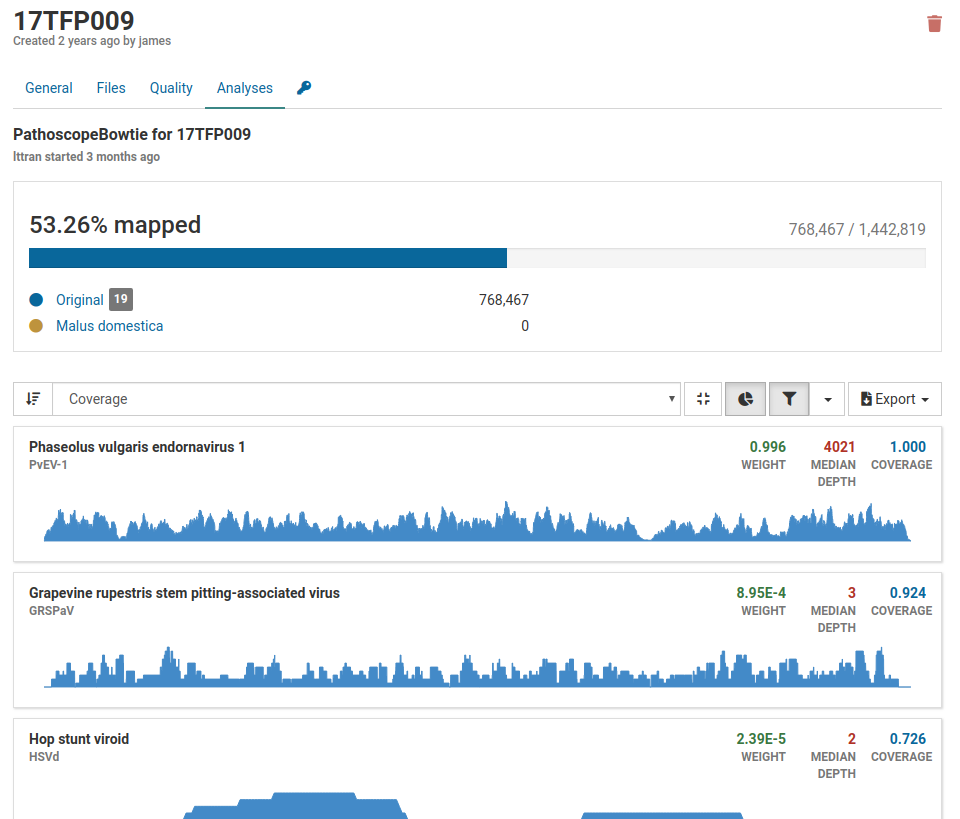
Although many mapped reads cover 53.26% of the viral genome, most listed pathogens are associated with grapevines. Grape viruses are uncommon in tree fruits, so this is likely contamination.
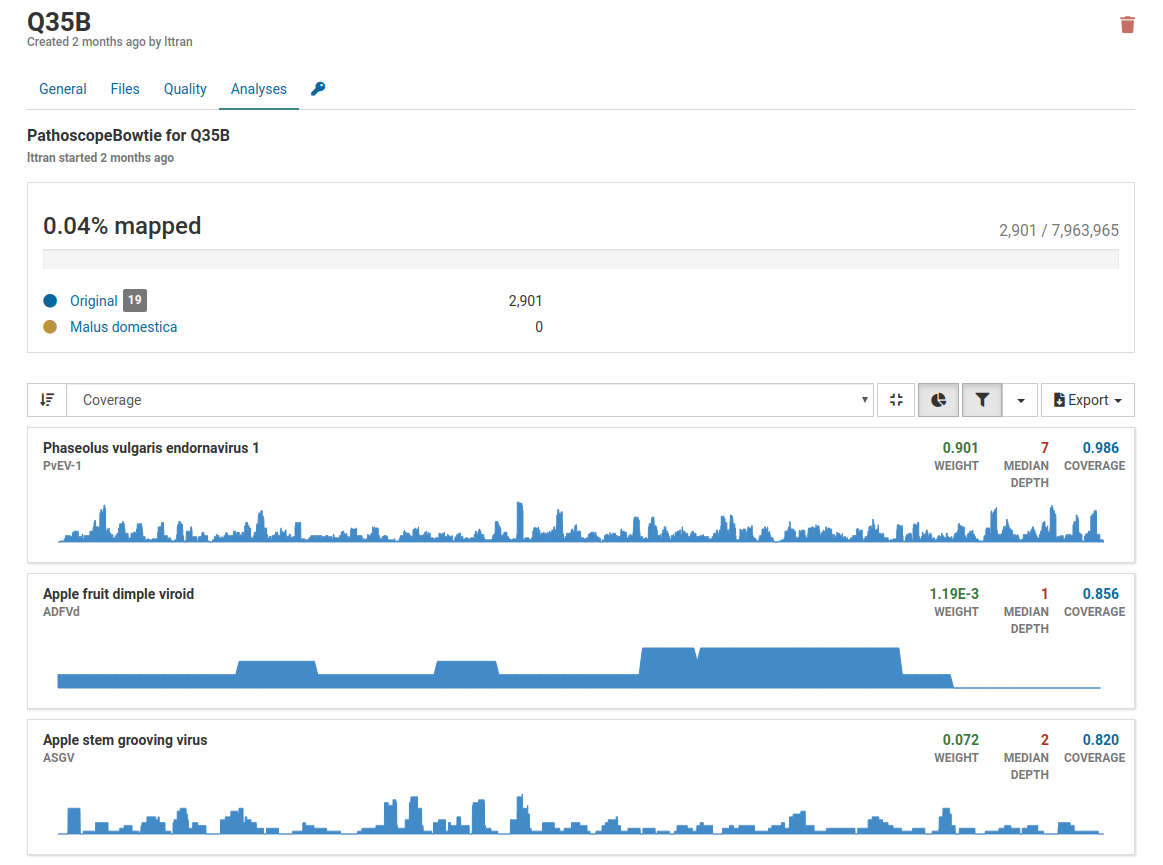
In this example, only 0.04% of reads map to the listed pathogens, so their apparent presence is weakly supported. Although weight and coverage are high, none has high depth, which suggests a low-quality sample.
The isolate coverage charts confirm this: maximum depth is 14, compared with values in the thousands for a high-quality positive sample.
Interpret Nuvs
The Basic Local Alignment Search Tool (BLAST) compares sequences with known sequences.
-
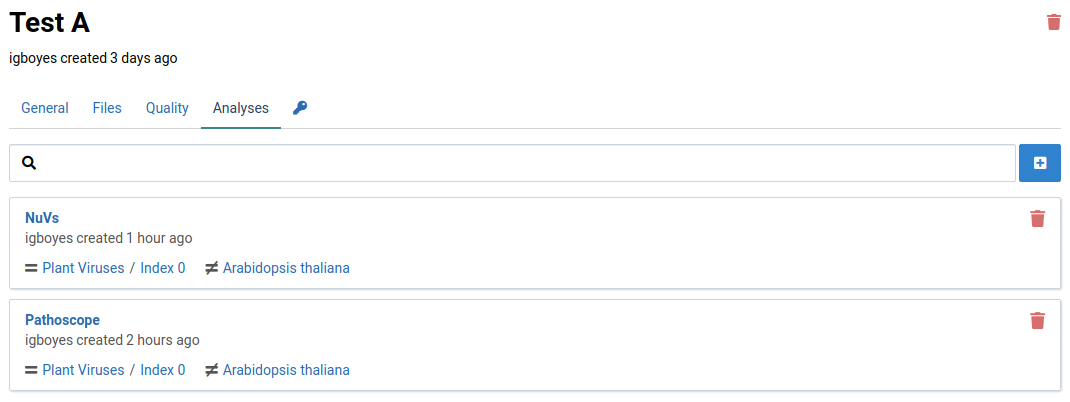
Navigate to the Analyses tab for a sample
-
Click the Nuvs analysis item
The list shows assembled sequence fragments (contigs) that may be part of a novel virus.
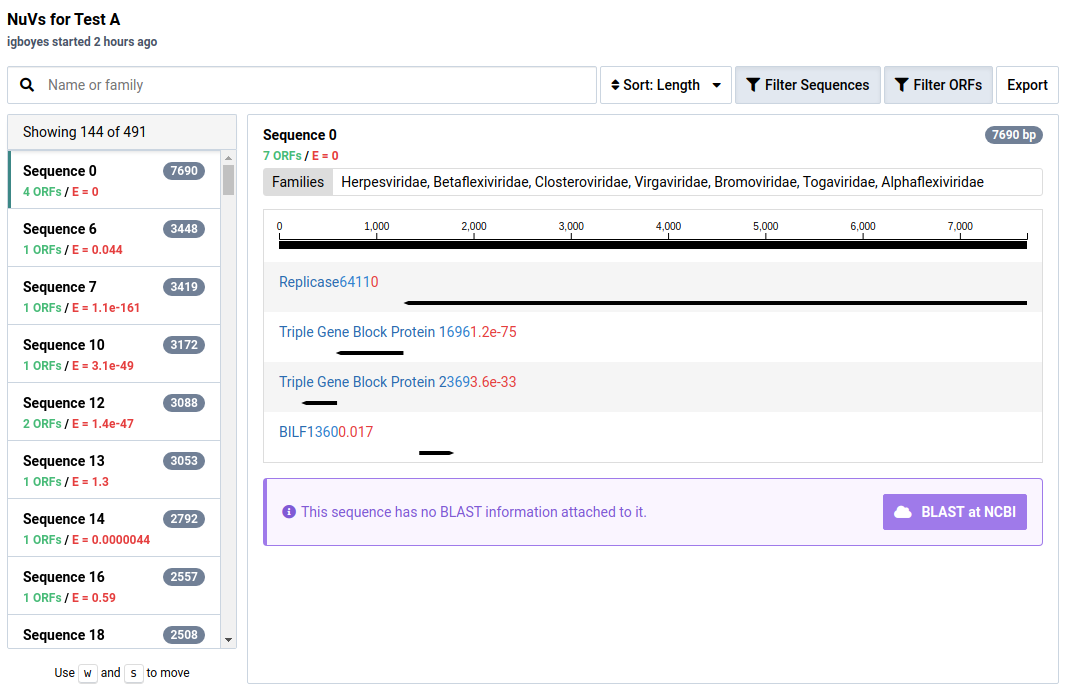
In the Nuvs workflow, sample libraries are assembled into contigs. Open reading frames (ORFs) are predicted from the contigs, and potential protein annotations are assigned using profile HMMs.
-
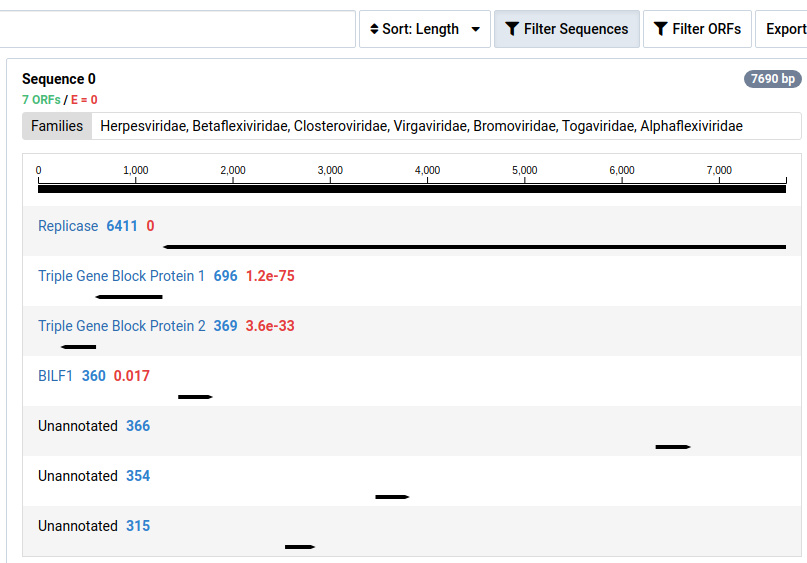
Click Filter ORFs to show ORFs with no HMM annotations
ORFs with no significant HMM hits aren’t shown by default.
-
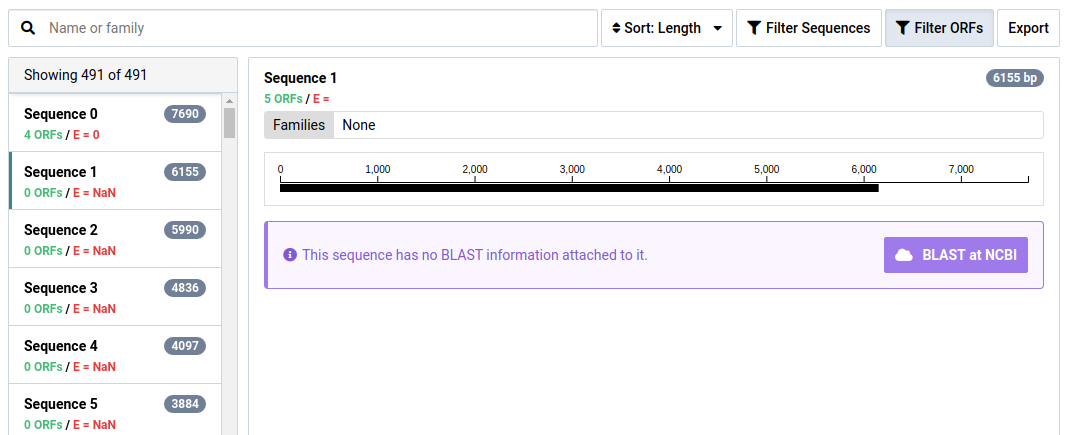
Click Filter Sequences to toggle the visibility of contigs without HMM annotations.
Contigs with no significant HMM hits aren’t shown by default.
-
Click BLAST at NCBI to BLAST the contig at NCBI

-
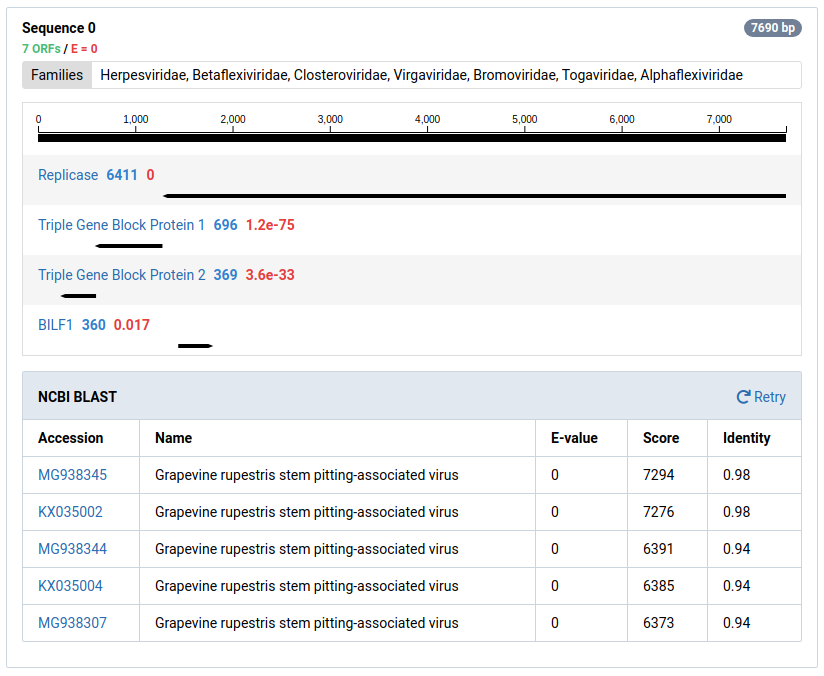
Wait for the BLAST search to complete.
Interpreting Nuvs results includes using BLAST to check whether contigs are unknown. The BLAST results for this sequence show that it likely came from contamination by a technician.
Nuvs discovers potential novel viral sequences in a sample library. The workflow:
- Remove known viral and subtraction reads
- Assemble sample reads into long sequences called contigs
- Predict open reading frames (ORFs) in the contigs
- Scan the translated ORFs for viral protein motifs using a collection of profile hidden Markov models (HMMs)
Under the Analyses tab, click the Nuvs analysis you want to view. The result viewer opens.
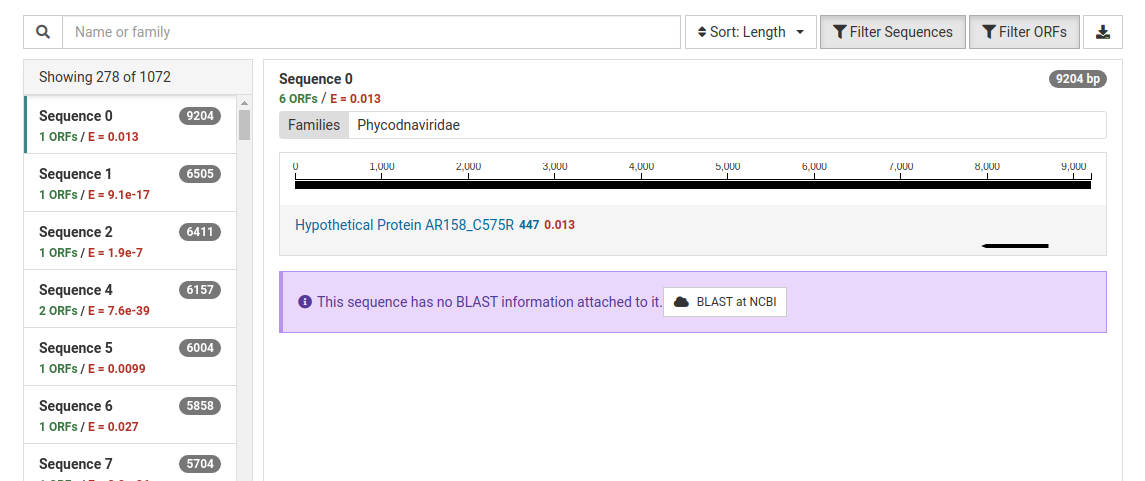
The Nuvs output lists numbered contigs. Each contig has three values:
| Value | Description |
|---|---|
| Length | Number of base pairs in the sequence |
| E-value | The probability that an ORF in the contig matches a known viral protein motif |
| ORFs | The number of open reading frames predicted in the contig |
A list of the assembled contigs is shown in the left pane. By default, contigs without ORFs that have significant HMM matches aren’t shown. Click Filter Sequences to show them. In this example, out of the 1072 assembled contigs, only 278 contained ORFs with significant HMM matches.
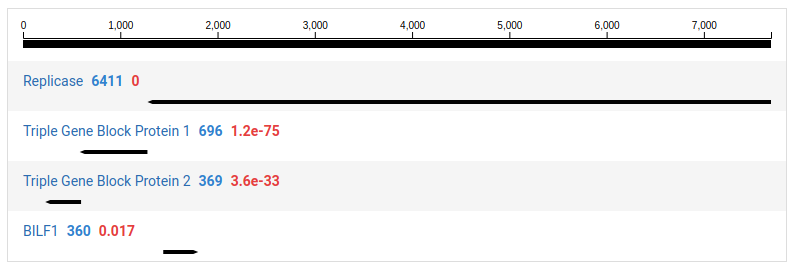
Select a contig in the left pane to view its details in the right pane. The contig is shown as a black line with identified ORFs below it. ORFs without significant HMM matches are hidden by default; click Filter ORFs to show them.
For each ORF with a significant HMM match, the graphic shows its size and E-value. The view also lists associated taxonomic families. The following example shows sequence 37 and its protein motifs.
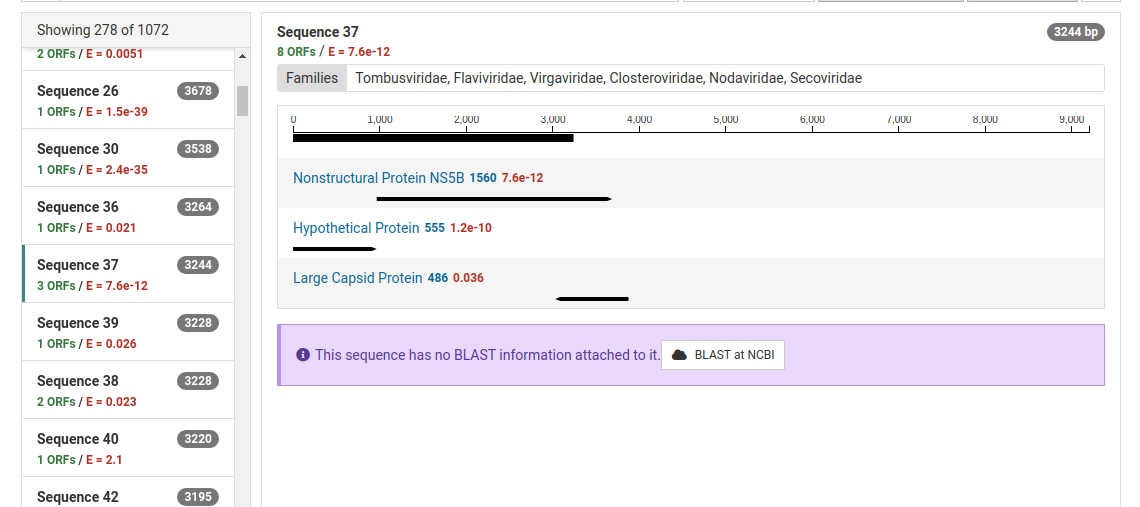
Contigs can be sent to NCBI for a BLAST search by clicking BLAST at NCBI. Many contigs derived from known viruses or non-viral sources are assembled. It’s necessary to BLAST significant contigs to ensure they’re novel.
Good result
When a BLAST search is completed, a result table is shown below the contig graphic. This table states the E-value, score, and identity of the viral sequences found on NCBI.
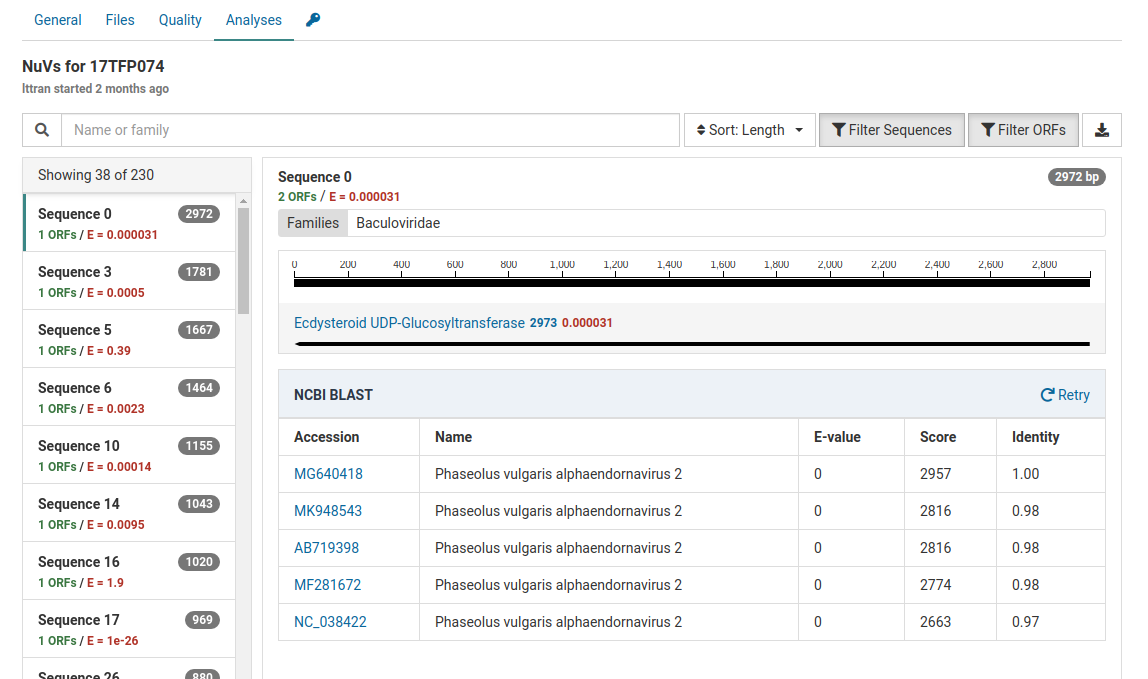
The E-values, scores, and identities in the BLAST results show high-quality matches. This indicates that these contigs don’t represent novel viral genomes. However, they don’t exist in the Virtool reference database because they weren’t eliminated during the initial subtraction step of the Nuvs workflow.
This sample contains Phaseolus vulgaris endornavirus as an internal control introduced during nucleic acid extraction. This explains the identification of Phaseolus vulgaris alphaendornavirus 2 in the sample.
Another contig has the following BLAST results:
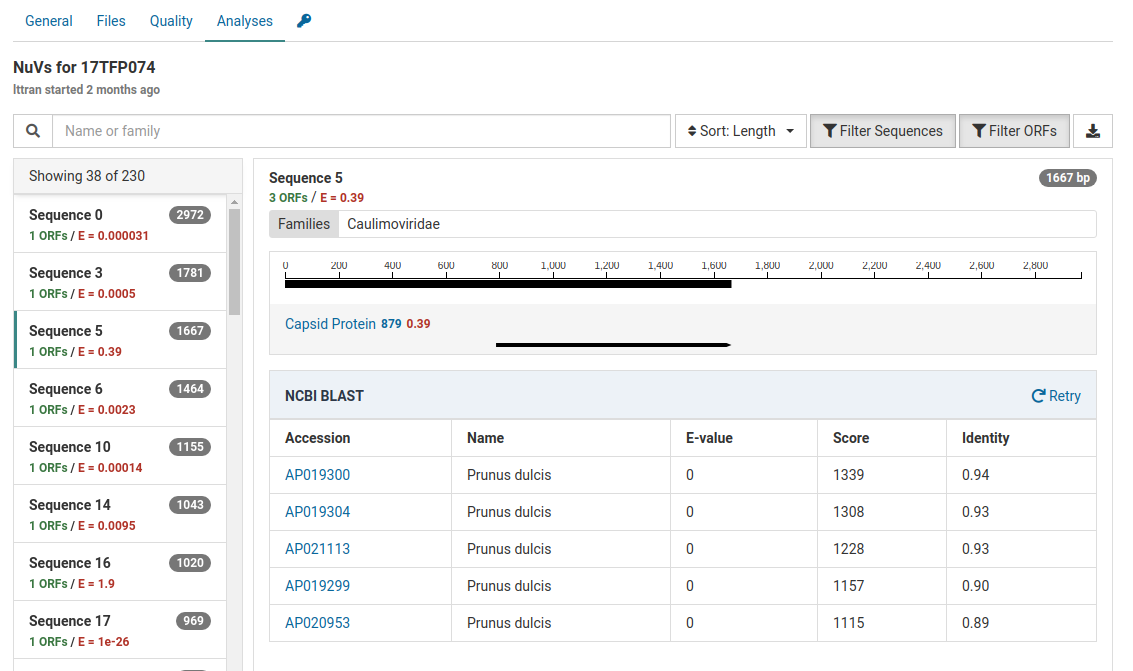
The high E-value for the HMM match (0.39) indicates the capsid protein match is tenuous.
Additionally, the BLAST results show that the contig is strongly related to Prunus dulcis (almond). The E-values for all accessions are zero and the scores and identities are high.
This sample is from a Prunus host. The most likely source of this contig is the host genome.
This interpretation assumes that the Prunus dulcis sequences used to build the HMM reference are actually from the host. It’s important to bear in mind that reference databases aren’t reliable and may contain viral nucleotide and protein sequences mis-annotated as originating from the host.
Suspicious result
The result view below suggests a potential novel virus.
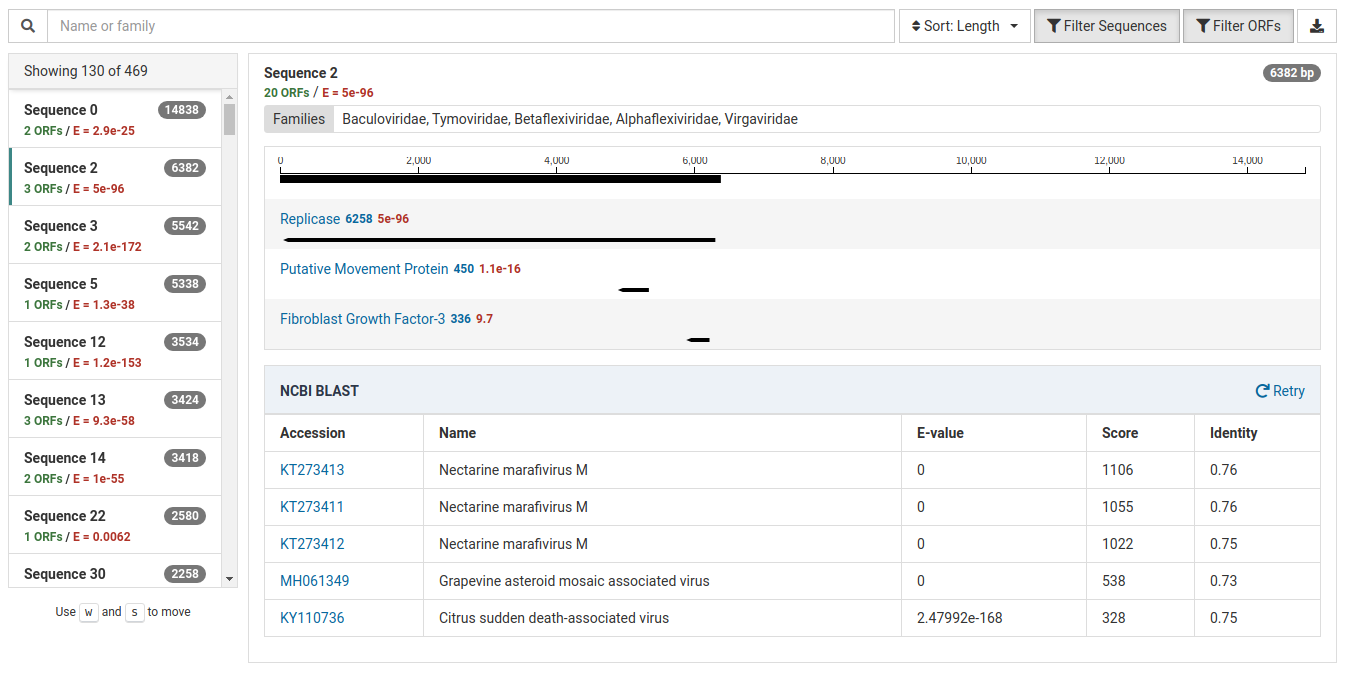
The HMM match has a low E-value of 5e-96, indicating a strong match.
The NCBI BLAST results suggest that this contig could represent a novel virus. The contig has significant BLAST hits to known viruses (for example, Nectarine marafivirus M), but the identities are low (0.73–0.76). This low identity suggests that the contig may represent a novel virus dissimilar to related known viruses.
Additionally, this sample is isolated from a Prunus host and Nectarine marafivirus M is not known to infect Prunus species. Because the size of the sequence is large (6382 bp) it’s worth assembling to discover more about the viral genome.
Non-viral result
This contig represents likely bacterial contamination from the field or laboratory:
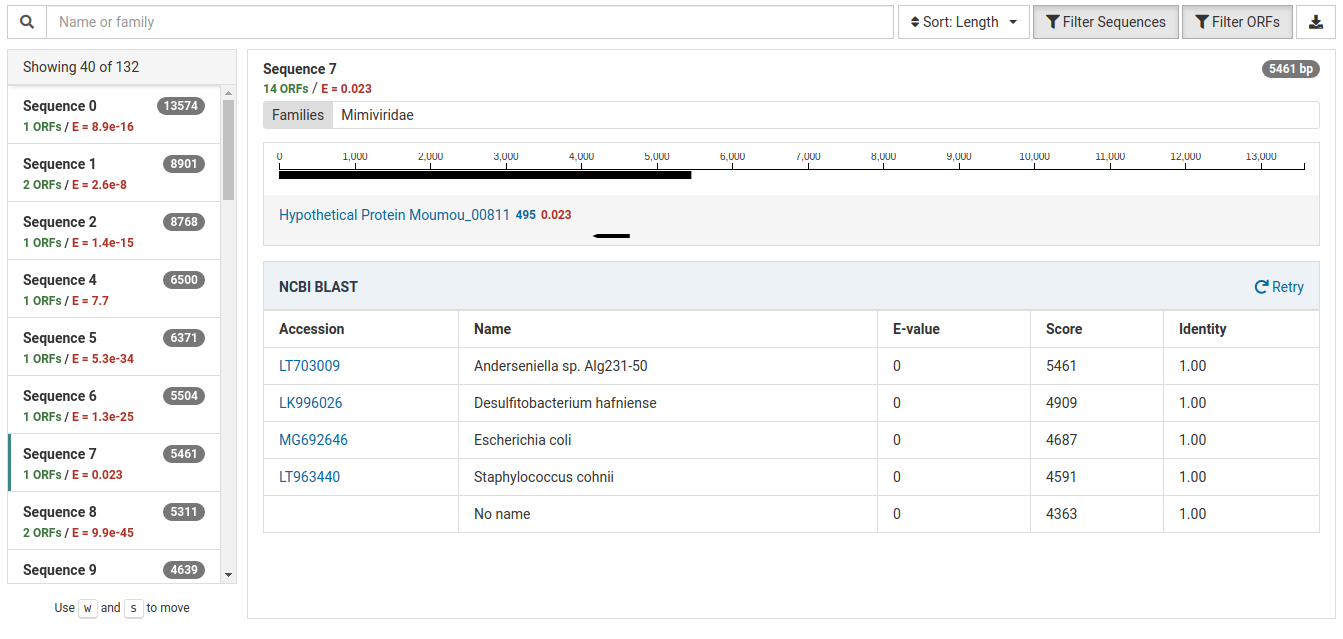
The BLAST results for this contig show hits for bacterial species, all with identities of 1.00. Based on their scores, they’re all similar matches. Knowing that these bacterial species aren’t commonly found in plants, specifically in Malus, this is most likely a case of contamination.
The following contig demonstrates contamination from a lab technician or field collector:
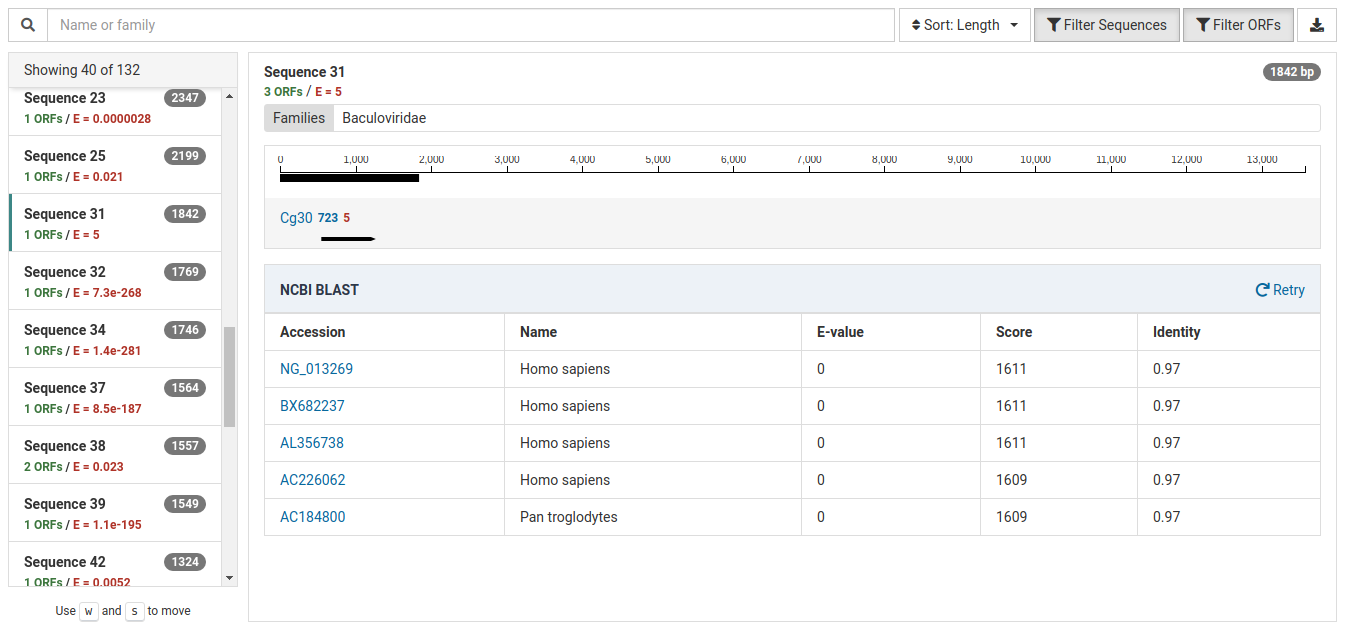
The E-value for the HMM match is weak, indicating that the annotation is unreliable.
Further, the BLAST results for this contig reveal strong matches to Homo sapiens (human) and Pan troglodytes (chimpanzee). Given this information, this is likely a case of human contamination.
Next steps
If a suspicious result is found during interpretation of Nuvs results, it’s important to further characterize the sequence using other bioinformatic tools with help from a bioinformatician. Nuvs makes a best effort to detect potential novel viral sequences automatically. Further manual work is almost always required to produce a full-length genome sequence.
In the common case that new variants of known viruses are found, adding them to a virus reference in Virtool is beneficial for future runs using Pathoscope. Doing so saves time analyzing data as more sequence information is available and also presents users with more accurate results.